Azure Storage Diagnostics
What is a diagnostic log? A diagnostic log provides information about the operations of a resource – in this case a storage account inside Azure.
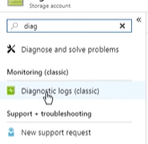
Let’s get right into it as this will be quick and easy today! First, log into your Azure portal, Browse to Storage Accounts then using the search bar enter ‘Diagnostic Logs’ and select it from the Monitoring section of results under your storage account.
When you select Diagnostic Logs (Classic) from the menu, you will see the current status is defaulted value is off:
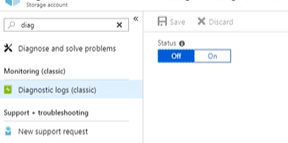
Let’s turn that on by selecting the Status toggle and clicking ‘On’ so that we can start collecting diagnostic information.
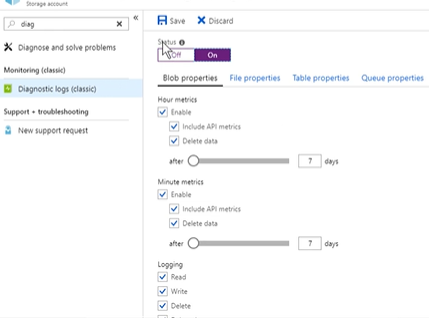
You can select some different metrics here now. Let’s choose some logical defaults: De-select ‘Enable’ under Hour Metrics — do this under each heading for Blob, File, Table, and Queue if you would like to turn off the Hour metrics.
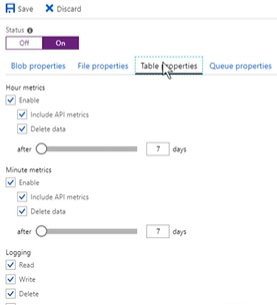
Under each Data type tab here, you will be able to configure the options individually for each of those types. If you are going to use this to trace some file access errors; which is the most frequent reason for using these logging features, you will want to enable everything under that tab and set the retention to something relevant for your needs such as ’14 days’ for example.
Ensure that if you would like Logging data (…and yes you most likely do!) that you enable the Logging data options at the bottom of each tab:
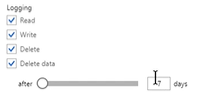
Set your Logging data retention – usually we would want to set this to match our diagnostic logging retention.
Once you have set your options ensure you click on ‘Save’ at the top.
To view the metrics information, you will need Azure Storage Explorer. You can download it for free from Microsoft here. Once you’ve got this installed, let’s keep reading.
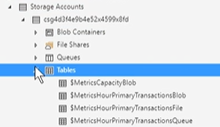
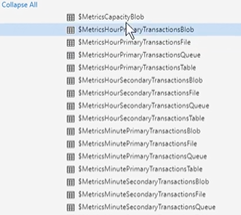
Log into Azure Storage Explorer and open your storage account that you have enabled the Diagnostic logging on. Expand Storage Accounts, Expand your selected Storage Account name, Tables, and here you will see the $MetricsMinutePrimaryTransactionsBlob, $MetricsMinutePrimaryTransactionFile, or you may see $MetricsHour…. if you left the Hour Metrics enabled.
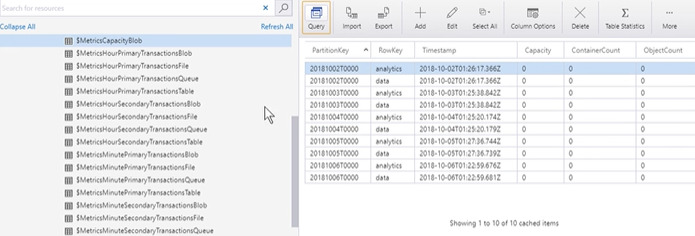
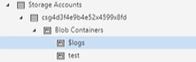
Notice that the Logging data is not shown under Tables inside your storage account. You can find it under the Blob storage:
Now that you know how to enable and access Diagnostic and Activity Logging for your storage accounts, you can use this data to help aid you in analysis of usage and trouble-shooting.