
How to Check the Health State of Microsoft Sentinel
Now that you have it deployed and collecting data, how to you monitor the health state of all the connectors and rules? One of the challenges with Sentinel is that this is often overlooked and data connectors can go days or weeks missing valuable logs without detection. Today, we look at how to make your data collection more robust and create a way to tell your SOC Team about broken tooling.
A challenge I often find with customers is that someone has come in and deployed Microsoft Sentinel, done a quick configuration on it, some governance may have been circled back to over time; but nobody has been keeping an eye on the health state of all the tooling: data connectors, automation rules, analytics rules, and all the inner-workings. This is so frustrating to hear about because it’s easy to fix!
Part of a well architected deployment of Sentinel includes monitoring.
Ok, let’s dive in and start taking a look at some of the things we can look at for health status, then we will jump right into creating a way to find out about issues.
Let’s get logged into Microsoft Sentinel in our tenant at https://portal.azure.com.
Next, let’s get into our Sentinel enabled Log Analytics Workspace, head to Logs and let’s run a quick query here to see something:
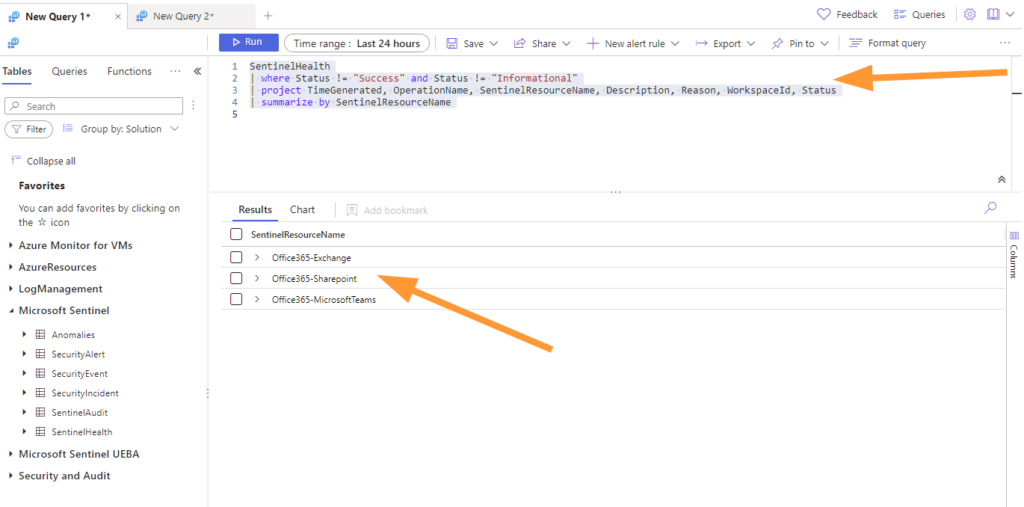
Here is the query so it’s easy to grab for you:
SentinelHealth
| where Status != "Success" and Status != "Informational"
| project TimeGenerated, OperationName, SentinelResourceName, Description, Reason, WorkspaceId, Status
| summarize by SentinelResourceName
Now, we can see that the query filters out any ‘success’ or ‘informational’ entries in the SentinelHealth table. Next, we grab some columns of interest and summarize just by the Name of resource. I’ll show you a fun trick with this same query later!
Right off the start we can see that we have 3 resources that have some type of issue:
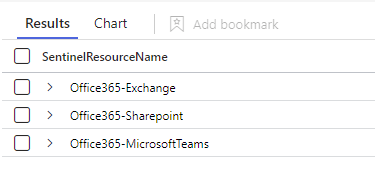
I wonder what type of issue we have with these?
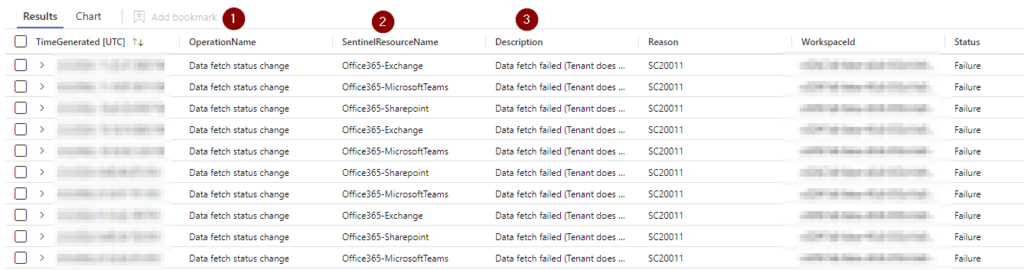
Well, we can easily get those details that you see here by removing the “Summarize” line from the query:
Now we can see all the details on each failure entry in the table. Now in my case for my testing environment, I purposely broke my Office365 data flow to get some cool screenshots for us, but you get the idea.
You’re thinking this is great, but how does this really help me out?
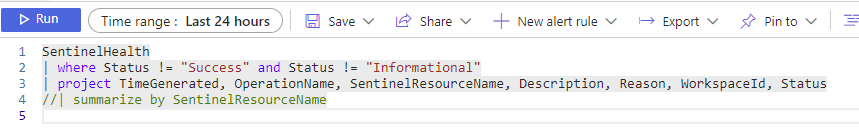
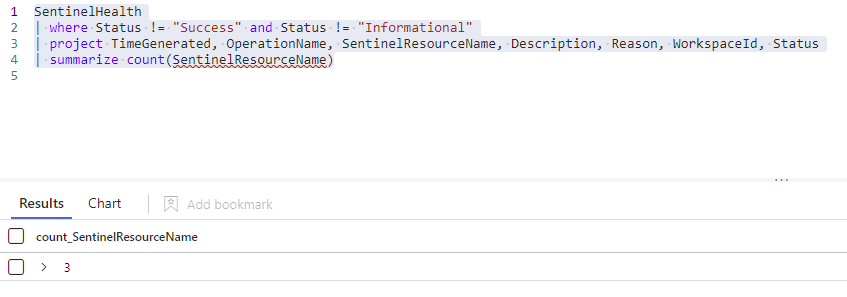
Let’s adjust our query slightly so it returns a number instead of a bunch of entries:
SentinelHealth
| where Status != "Success" and Status != "Informational"
| project TimeGenerated, OperationName, SentinelResourceName, Description, Reason, WorkspaceId, Status
| summarize count(SentinelResourceName)
All we have changed is the last line from ‘summarize by’ to ‘count’ by the resource name field.
Notice how we took the same basic query through 3 different iterations?
- First the query gave us some summary results to let us understand what has errors.
- Second, we removed just the summary part so we could see details about what might be happening.
- Lastly, we changed it to a count so we can do a quick check on the count of resources with an error.
I told you we would do something cool with that simple KQL today!
Well, let’s take this same query and create an Analytics Rule to tell us about these errors when they happen. I’m a fan of the once per day check in this case as we don’t need to know about this at 2am….unless you are running a 24hr operation in your SOC of course, then feel free to set the frequency to run this in a way that meets your business requirements.
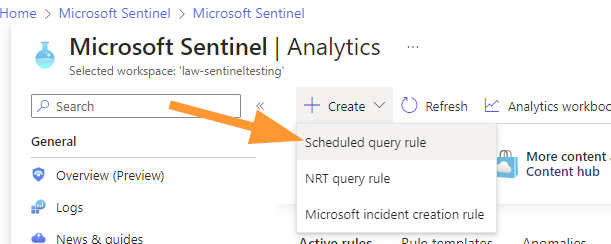
In your Sentinel workspace, head to Analytics.
Next select Create > Scheduled Query Rule
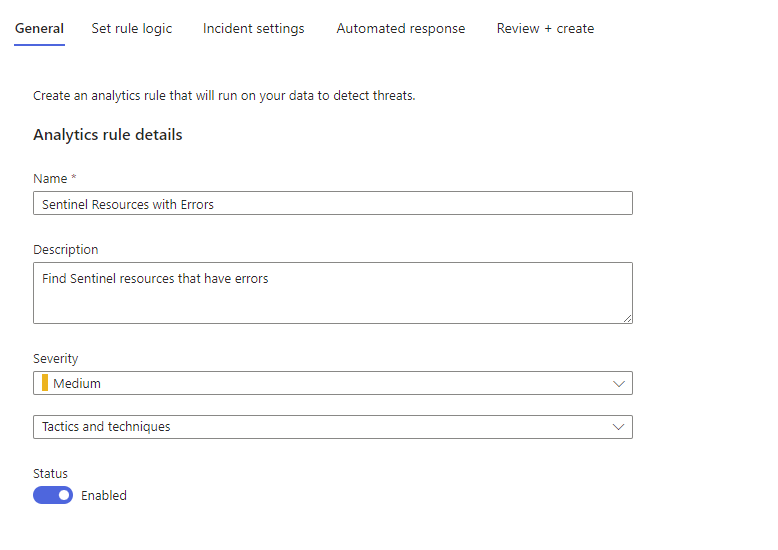
Name your rule and add a meaningful description:
Ok, now paste that query with the count into the RULE QUERY field. Ensure that you are not using a summarize or count statement here for this rule.
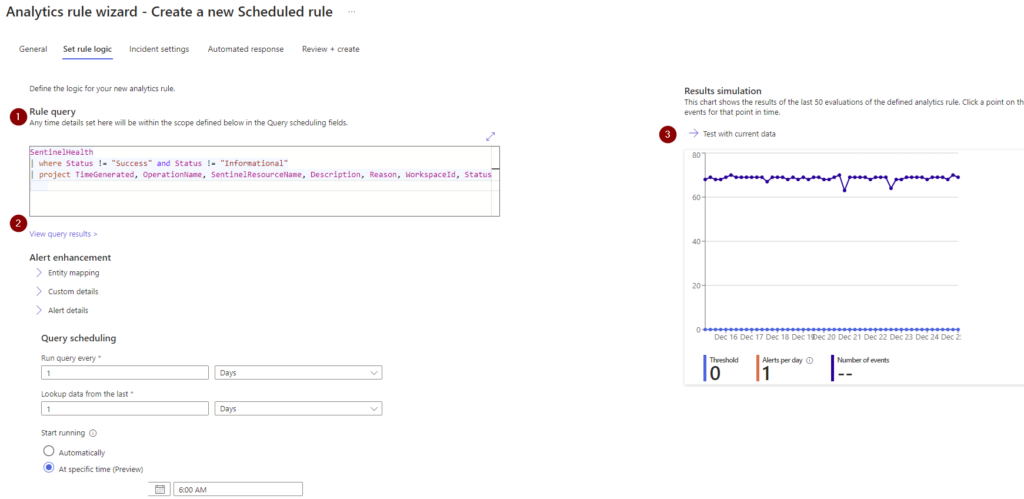
When you move the focus off the query field you will notice that the KQL is validated to ensure it is a query that we can use to run in the rule. The next thing I do here is TEST WITH CURRENT DATA (3) because it let’s me see the validation and if the data is what I am expecting to see!
Next set the QUERY SCHEDULING fields and LOOKUP DATA FROM THE LAST field. I’m a fan of once per day for health status checks at 6am so that when I log in for the day any issues have a fresh incident for my SOC team to look at right away. I keep these incidents as a MEDIUM severity because I want TRUE POSITIVES in the high severity type to always draw my teams eye quickly! This is a bit of a balancing act honestly, but medium is a happy medium!
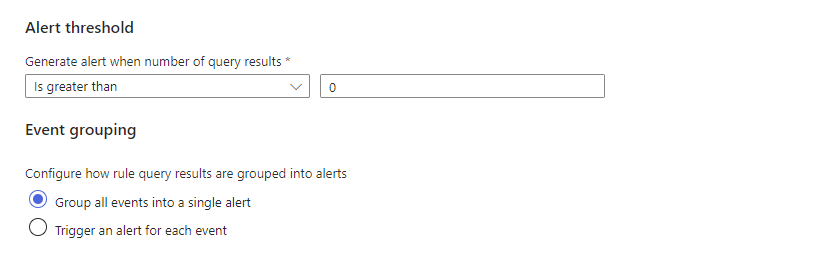
Next, set the ALERT THRESHOLD field to is greater than 0
Next set your INCIDENT SETTINGS:
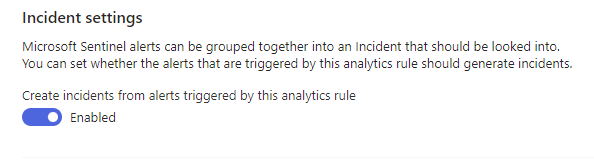
Ensure that this is ENABLED. (Default is enabled!)
This is the part that will tell us in the Incident queue that we have an issue.
Create your Analytics rule, and now once per day at 6am this rule will run to check the last 1 day against our query and see if we have any issues with our Sentinel Resources.
This checks for our Data connectors, analytics rules, and other Sentinel resources that we have configured. Excellent!
Thanks for joining me on this journey through Sentinel health exploration and alerting; join me next time for some more fun in Azure!