
Responding to Incidents with Microsoft Sentinel – Part 4 – Automate Research
In this article we will build on previous automation experiences to enhance your Microsoft Sentinel environment. Today we will take a detailed look at using Sentinel Playbooks and gathering information on an Incident automatically. In this post, you can follow along and build your own playbook along with me, or change it up to meet your requirements.
If you missed it, the previous article is here. If you want to read the article series from the beginning, you can start here.
Having information gathered, research basics covered using automatic lookup tools (IE: Playbooks), and updates added to Sentinel incidents before your SOC Analysts open the details is important. This is one of the easiest ways to improve SOC productivity, give your Analysts information they need to make decisions, and optimize your Analyst’s time so they can take action on incidents faster.
Let’s jump in and start building our Sentinel Playbook automation to lookup entity information and update the incident before any humans even get involved.
Prerequisites
You’ll need to do a couple things to get ready to complete our build today.
- Create a Virus Total account
- https://virustotal.com
- Create an account and request an API key.
- We will need this API key to do some lookups.
- Let’s review the Virus Total Connector (Preview still as of July 2023)
- https://docs.microsoft.com/en-us/connectors/virustotal/
- This connector has been in preview for over one year, it’s worth a review in your test environment as we go through this article, but always a warning that Preview items should not be used in Production environments as there is a support limitation, and an inherited risk should the Preview connector stop working in the future.
Create the Playbook
To create your playbook, first let’s get to your Microsoft Sentinel testing environment through Azure portal at https://portal.azure.com. Once you’re logged in, head to your Microsoft Sentinel enabled Log Analytics Workspace, open Sentinel and then under the Configuration section choose Automation.
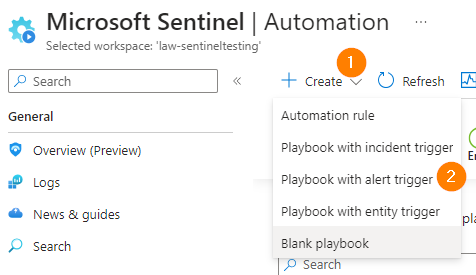
Choose Create > Playbook with alert trigger and a new blade will open.
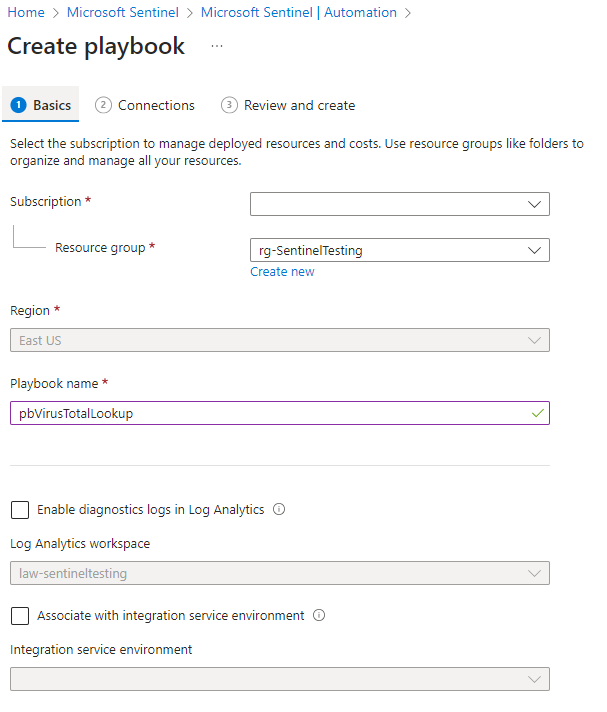
Create your playbook, selecting your desired resource group, matched region, enter a meaningful name, and click on Next.
Confirm your choices:
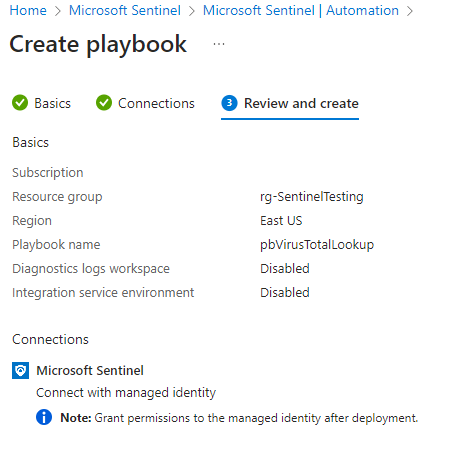
Click on Create when you are ready.
Brief Diversion – Pro Tip
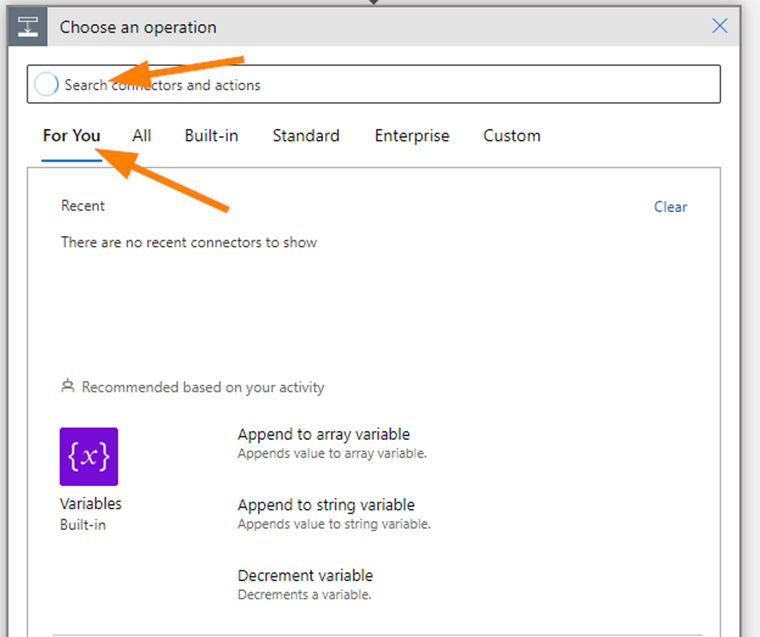
In a playbook, when adding the ‘New Step’, search on the step needed & click on For You.
- The logic step or connector you will want is often here and it is a fast way to find it!
Back to Creating our Playbook

You should now be on the Logic App Designer blade. Note that breadcrumb navigation trail above, it’s a nice easy way to jump back to Sentinel and to understand the layers we go through to get to the playbook.
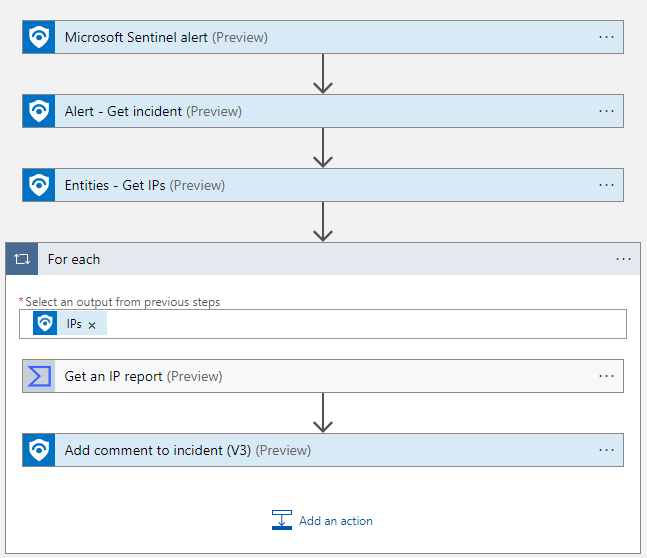
Click on New Step > Choose Microsoft Sentinel and then click on the search field. Enter “get incident” and select that option. It sounds like a lot of steps typed out here, but I promise it will go smoothly!
Ok, now here’s where we get to do some configuration. First, select the Specify Subscription ID field, a little pop-up box shows, click in that Search field and start typing “Subscription ID”. When the correct dynamic field appears in the results, select it.
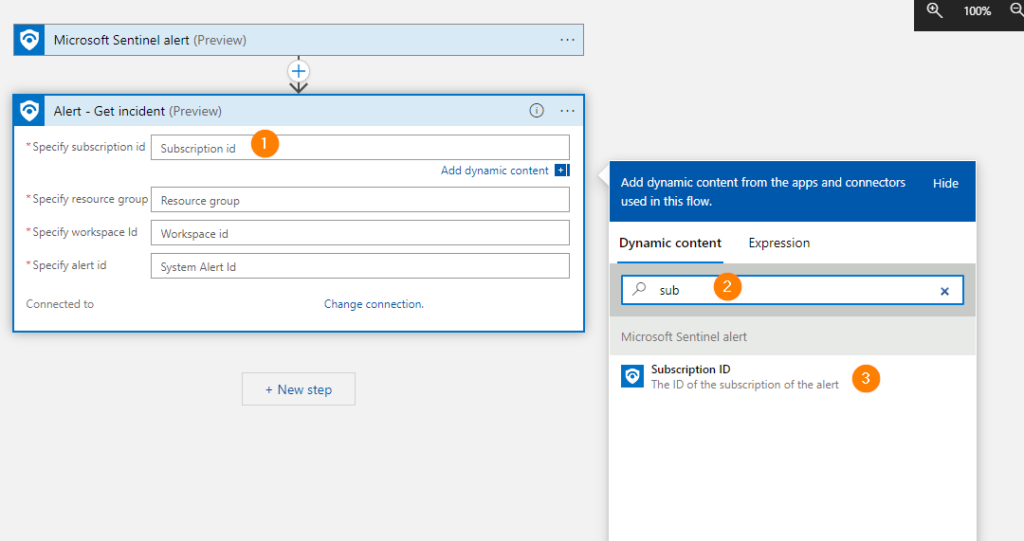
Follow the 1 – 2- 3 order for Field, Search, and Select….and it’s that tough!
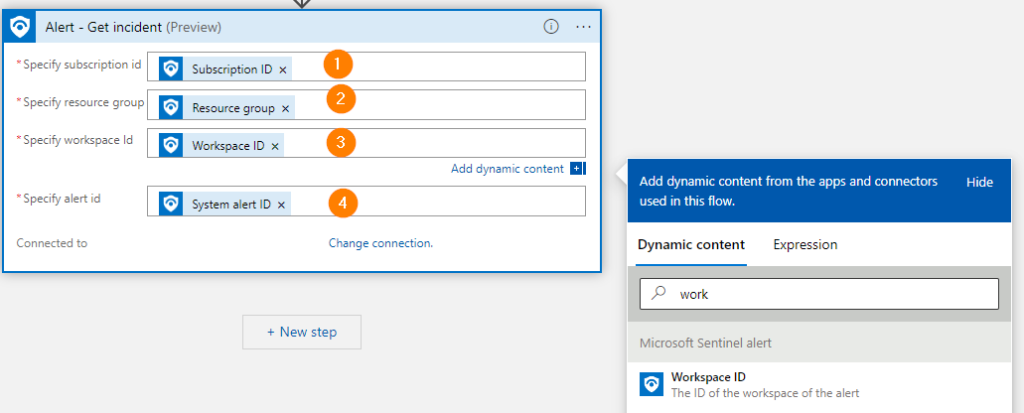
Now for the other fields, make them match:
1. Subscription id
2. Resource group
3. Workspace ID
4. System alert ID
Much like this image below:
We’ve made some changes, so let’s save our work:
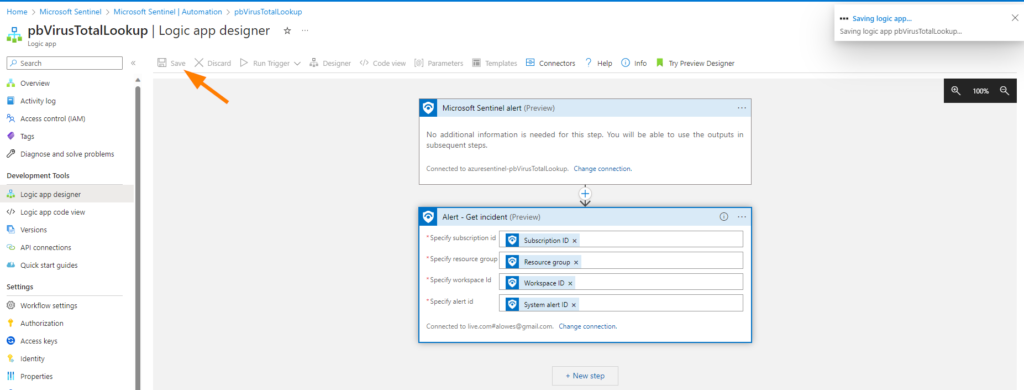
If you run into a save error at this step, check your connection settings in the bottom link of the Alert – Get Incident step and ensure it connects to your Sentinel environment successfully. I have seen this happen occasionally, so don’t panic if this happens. Remember that spiel about Preview connectors and production environments? Moving on…..
Select New Step again and let’s add a Microsoft Sentinel “Entities – Get IPs”. (Preview)
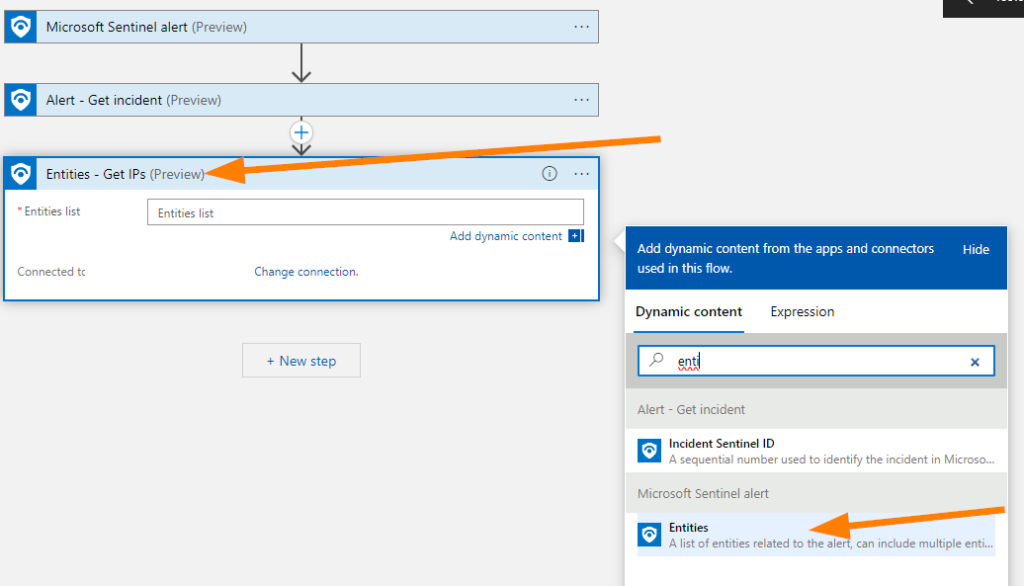
Save your work, or if you like to take chances, just keep on rolling ahead.
Let’s put this alert information to work for us now!
Once more, let’s add a New Step > then enter Virus Total in the search field and then select the Virus Total connector.
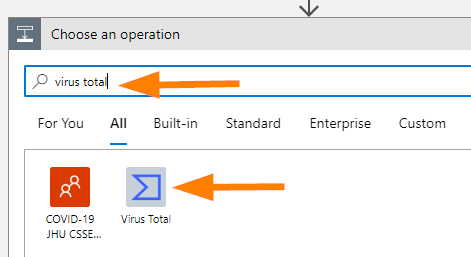
In Select an output, choose IPs.
Now, notice that your logic app automatically created a For Each loop for you. This is awesome!
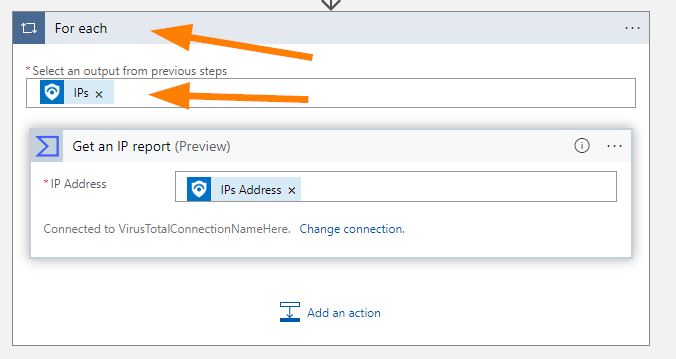
Next up, choose Add an Action near the bottom.
Choose Microsoft Sentinel > Add a comment to Incident v3.
Now, let’s add some fields coming back from Virus Total into the Alert that we are working on.
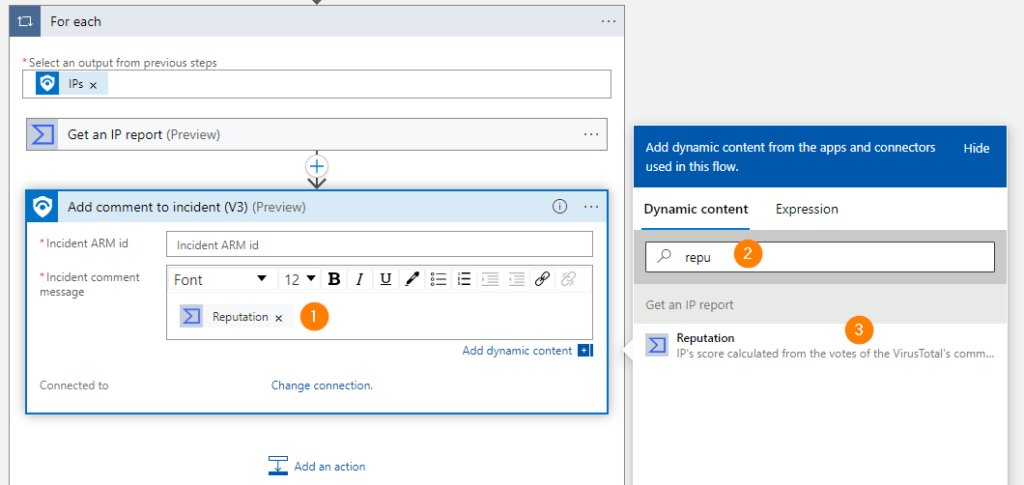
I’ve added a bunch of fields that can be useful, feel free to add others or trim it down and add only what is needed to provide meaningful information for your SOC team here.
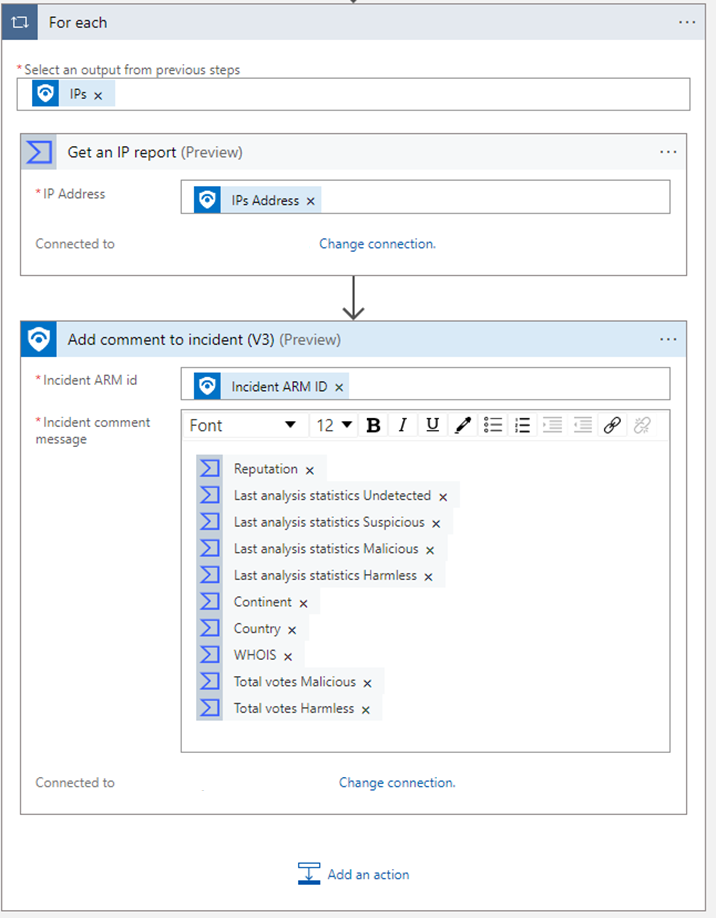
I typically add:
- Continent
- Country
- WHOIS
- Reputation
- Last Analysis statistics Undetected / Suspicious / Malicious / Harmless
- Total votes Malicious
- Total votes Harmless
I like to add some labels to our data fields so that they are faster to read at a glance for SOC Team members:
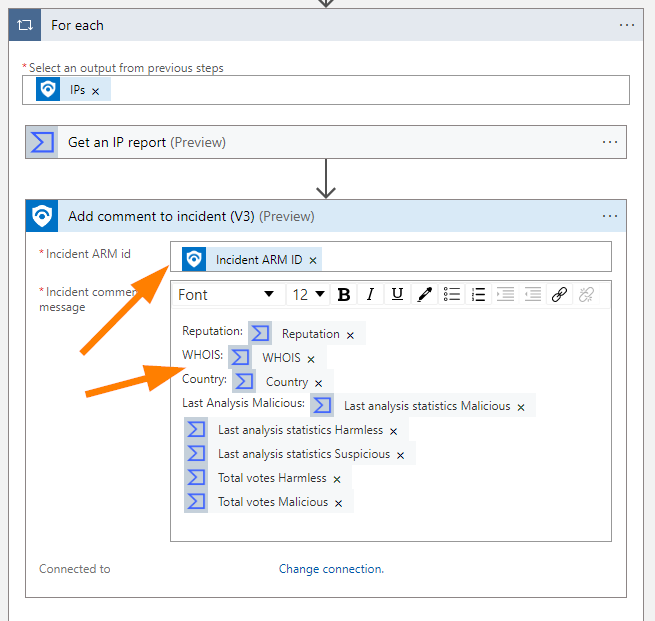
Feel free to switch things up, add line breaks or spaces or separators where logical for display purposes and readability.
When I was building this demo playbook I noticed that the Incident ARM ID for the comment step disappeared on me, make sure it is entered as shown in the above screenshot before saving.
Let’s save our work again here. Even if you enjoy taking those chances, we wouldn’t want to have to add all that again.
Final Step – Connect your Virus Total API Key
So, through all of the clicking and fields we have setup so far….we haven’t actually told the VirusTotal connector how to talk to VirusTotal yet. Let’s get that setup before we move on….
In our For Each loop, expand Get an IP Report:
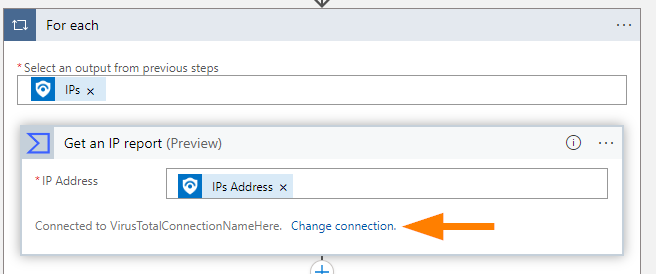
Click on Change Connection and our widget title changes to Connections now. Next select Add New.
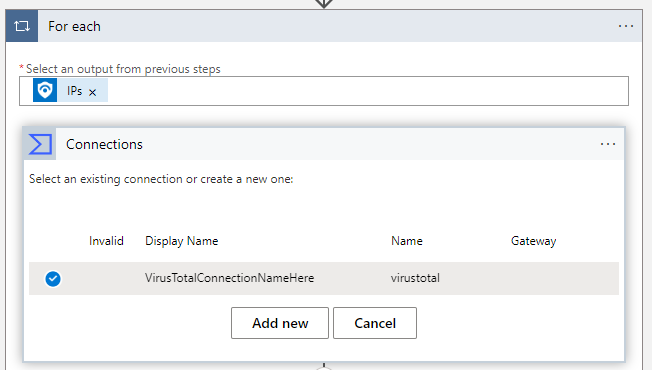
Then enter a name for the connection (I really do like the default name!) and your Virus Total API Key. Click on create and then confirm your new connection is selected:
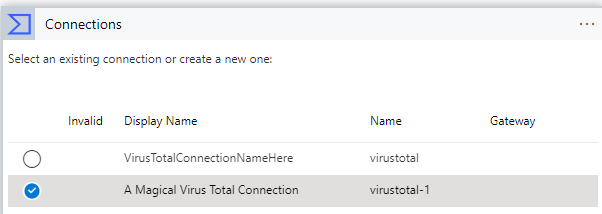
It’s interesting, but the API key is not validated at this stage, that will happen when your playbook is triggered with a new alert after saving. Let’s save!

Now you can go and test this out!
One thing I’ve found with lookup playbooks is that I often need to troubleshoot the connection at different steps in the playbook, don’t be too surprised when you need to do this in your own.
I hope this has helped take some of the mystery out of Automating Research and Lookups for your alerts and incidents in Sentinel, and made creating a playbook a bit easier at the same time! Thank you for working through all the steps to get a lookup working, and for all the effort you are putting into making your own SOC environment more efficient and effective!
Join me in the next article for a continued look at responding to incidents in Microsoft Sentinel!