
Set Log Analytics Workspace Data Cap
When an organization is testing readiness for their Microsoft Sentinel configurations, often a Data Cap on the Log Analytics Workspace is used as a way to help control the amount of data coming into the storage account. Today, we take a look at how to configure that data cap.
There are just a few steps to get the data cap configured in your Log Analytics workspace, so first let’s get logged into your tenant at https://portal.azure.com. Make sure you are in your testing instance of Sentinel or your Dev/Test subscription where Sentinel is used for testing first.
There is a quick aside here, that if you are collecting Microsoft Defender for Cloud data, the data cap does not stop the collection of certain types of data, unless you setup Microsoft Defender for Cloud and installed it with your workspace before June 19, 2017. Check out the details of that here.
To set your daily data cap, head to your Log Analytics Workspace in the Azure Portal.
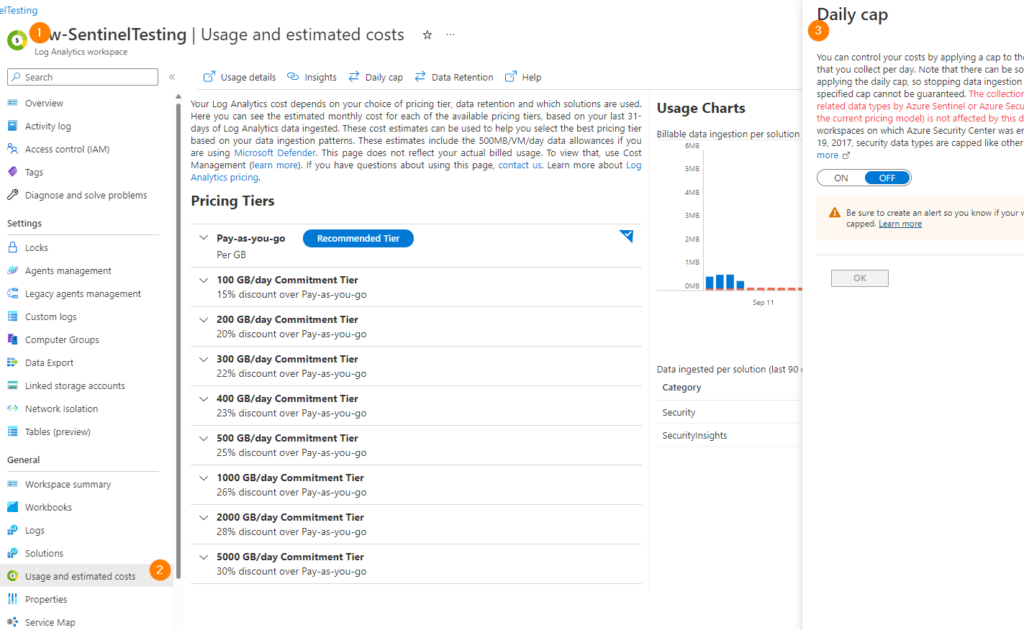
Next, choose Usage and Estimated Costs.
A new blade opens up called DAILY CAP.
Change the slider from OFF to ON. Set your data cap in GB, for this example I’ve chosen 150GB per day.
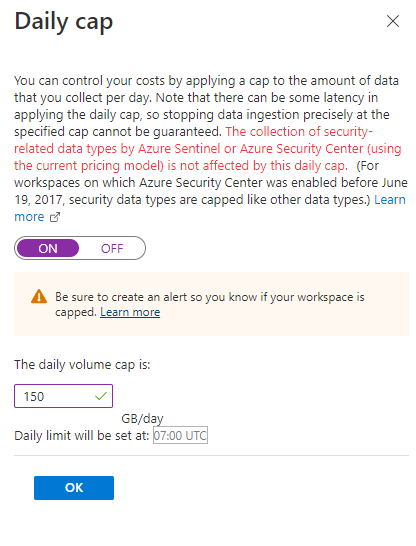
Click on OK to save your changes.
Now you will only ingest 150GB per day of data into the selected Log Analytics workspace. I always urge thoughtfulness around this configuration in production because we cannot examine and alert on data that we don’t have; so please consider that when talking about data caps in production scenarios.
Now, if you would like to get an alert once your data cap is reached, read on:
Azure Monitor has four types of alerts that we can work with overall. The type we will target per the settings below is Log alerts. To receive an alert when the daily cap is reached, create a log alert rule with the following details.
| Setting | Value |
|---|---|
| Scope | |
| Target scope | Select your Log Analytics workspace. |
| Condition | |
| Signal type | Log |
| Signal name | Custom log search |
| Query | _LogOperation | where Operation =~ "Data collection stopped" | where Detail contains "OverQuota" |
| Measurement | Measure: Table rows Aggregation type: Count Aggregation granularity: 5 minutes |
| Alert Logic | Operator: Greater than Threshold value: 0 Frequency of evaluation: 5 minutes |
| Actions | Select or add an action group to notify you when the threshold is exceeded. |
| Details | |
| Severity | Warning |
| Alert rule name | Daily data limit reached |
Learn more about Azure Monitor alerting here.