Azure Monitor – Virtual Machines
Today I wanted to talk about Azure Monitor and one of the new functionalities the Azure Team has added – Virtual Machine Monitoring. This is a perfect example of a continuous improvement and basing new features on user feedback, great job Azure! Now, to get started monitoring your virtual machines we will need to check a few items off the list.
First, you’ll need an Azure subscription. If you don’t already have one, go ahead and setup a free trial at https://portal.azure.com. Once you’re all setup, make sure you have a couple of virtual machines; if you are in a trial or test environment, just choose some low-cost Linux machines to get started in the examples today. We don’t need to get too fancy here! Now, as always — please make sure you are in a test or dev environment so we are not impacting a production system. Those awesome free Azure trials are just perfect for this! Just sayin’.
Next, you’ll need to have a Log Analytics workspace setup for your data collection and analysis of performance data; if you’d like to skip this part and use defaults – please feel free to skip this part and jump ahead to where we enable monitoring on your VMs.
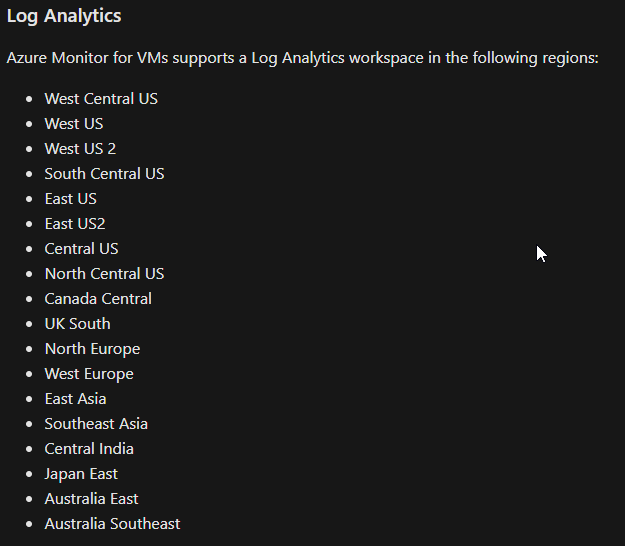
While you can monitor VMs in any Azure region, you can only setup a Log Analytics workspace in the following regions, so head’s up:
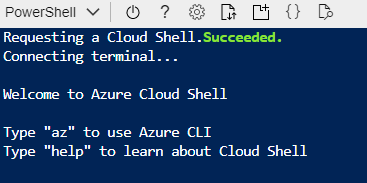
Let’s get that workspace setup using Azure Cloud Shell and CLI. Go ahead and click on the cloud shell icon.

Now, you’ll see a couple things populate into your console, I meant cloud shell.
To start using CLI simply type “az” and hit enter like it says! Again, a few things will flash up pretty quickly here, feel free to take a moment and read the text in the CLI. I’m a fan of ASCII art, so the text logo is pretty cool if you ask me!
Now that your CLI is ready, you can visit the Microsoft Docs page at https://docs.microsoft.com/en-us/azure/azure-monitor/learn/quick-create-workspace-cli to get a JSON template and customize it to build your workspace. Once you are ready to jump back in, the CLI command to kick it off is: az group deployment create --resource-group --name --template-file deploylaworkspacetemplate.json
If you follow those directions, you’ll be up and running with your workspace in about 15 minutes….if you take a few minutes to sip your coffee of course.
Skipping ahead from earlier? Start here again…
Azure Monitor for virtual machines uses data from the Microsoft Dependency agent. Microsoft advises that whether deploying monitor to one VM or thousands, you will need to use the Azure VM Dependency agent extension. You can read all about that here: https://docs.microsoft.com/en-us/azure/virtual-machines/extensions/agent-dependency-windows. Without doing a deep-dive on this here today, let’s jump right into enabling the monitoring on your VMs! Exciting times folks!
I want to talk about two paths here:
- Enabling Monitoring for a virtual machine scale set, and
- Enabling Monitoring for a single Azure virtual machine.
First, Scale Sets:
- From your Azure portal (https://portal.azure.com) dashboard or home, select Virtual Machine Scale Sets. You can type this into the search box and select it if it’s not in your sidebar menu.
- Select Virtual Machine scale set then select Monitoring and Insights.
- Select Enable.
- If you wish to use your Log Analytics workspace, select it from the drop-down list on the onboarding page.
- You will see a message that “Insights deployment is in progress”.
- Once enabled, you can begin collecting the monitoring data now and use the workspace to analyze your monitoring data.
Second, Single VM:
- From your Azure portal (https://portal.azure.com) dashboard or home, select Virtual Machines. You can type this into the search box and select it from the drop-down that shows.
- From your list of virtual machines, select the one you want to deploy monitoring into.
- Select the Monitoring section, Insights, then Enable.
- Again here, if you wish to use your Log Analytics workspace, select it from the drop-down list on the onboarding page that will display.
- You will see a message that “Insights deployment is in progress”.
- Once enabled, you can begin collecting the monitoring data now and use the workspace to analyze your monitoring data.
In a future article, I’ll talk about viewing your collected performance data from your Log Analytics workspace and what to do with all that information about your virtual machines. As always, I encourage everyone to play with settings and discover what happens when you make changes — just play safely in your test subscription folks!