Mastering Data Ingestion in Microsoft Sentinel
In this post, we examine how to review and master your data connectors to optimize ingestion. Organizations worldwide are investing in sophisticated tools like Microsoft Sentinel to safeguard their infrastructure from evolving threats. The effectiveness of these tools hinges on a single critical aspect: data ingestion. Understanding how to manage data ingestion in Microsoft Sentinel is not just about ensuring comprehensive security coverage—it’s about making sure your organization can swiftly detect, investigate, and respond to security incidents.
Data ingestion is more than just a technical necessity; it’s a strategic component of your overall security posture. Whether you’re dealing with real-time data flows for immediate analysis or batch processing for detailed historical reviews, the decisions you make around data ingestion can significantly impact your organization’s security efficacy and cost management.
There is also a governance aspect in a SIEM solution that should be driving us to review our existing data ingestion, ensure that all of the data has a requirement to be in our environment. (See other articles on AzureTracks.com about data use cases and data requirements such as frameworks.) Not all data sources are equal – there may be too many fields – or not enough source data to draw entities into an incident in Sentinel.
Interactive vs. Archive Ingestion
Microsoft Sentinel’s data ingestion strategy can be divided into interactive and archive ingestion. Interactive ingestion refers to the process of streaming data into Sentinel in real-time. This allows for immediate analysis and quick response to incidents as they occur. Real-time data flows are crucial for high-stakes environments where timely detection of security breaches is essential. Think identity and edge events, malware, and lateral movement detections.
Archive ingestion, on the other hand, involves batch processing of data that may not require immediate attention but is still valuable for long-term analysis and compliance. This method is more cost-effective as it does not demand constant processing power. Archive ingestion is ideal for periodic reviews and trend analysis over extended periods. Think detailed edge logs, network, and other table you may run a hunting query or scheduled query against less frequently.
Analytics vs. Basic Logs
Understanding the difference between analytics and basic logs is crucial in optimizing your data ingestion strategy. Analytics logs are enriched with contextual information and optimized for detailed analysis and complex queries. These logs are essential for in-depth threat detection and forensic investigations, albeit at a higher ingestion cost.
Basic logs, while more cost-effective, are designed for simpler queries and operational monitoring. They may not provide the same level of detail as analytics logs but are valuable for maintaining an overview of system health and detecting basic anomalies. Balancing the use of analytics and basic logs ensures that you can manage costs without compromising on security.
Building Use Cases for Data Requirements
Creating specific use cases for your data requirements is essential to maximize the value of your data ingestion strategy. By clearly defining what you aim to achieve with your data, you can tailor your ingestion policies to support these objectives. For example, a use case focused on detecting anomalous login activities would require detailed login logs and a real-time ingestion method that allows for immediate trend analysis and incident investigation.
Developing robust use cases helps in prioritizing data sources and setting appropriate ingestion methods. This targeted approach reduces the likelihood of ingesting unnecessary data, thereby optimizing costs and enhancing the relevance of your data. It also aids in reducing noise and false positives, allowing your security team to focus on genuine threats.
Steps for Checking Data Connector Ingestion Volume and Activity in Microsoft Sentinel
Checking Ingestion Volume
- Access Log Analytics Workspace:
- Navigate to your Log Analytics workspace in the Azure portal.
- Select the workspace associated with Microsoft Sentinel.
- Review Ingestion Data:
- Go to Logs under the General section.
- Use the following KQL query to check ingestion volume:
// Summarize ingested data volume by data type
Usage
| summarize IngestedDataMB = sum(Quantity) by DataType
| sort by IngestedDataMB desc
Identifying Active Tables
- List Active Tables:
- Analytics workspace, use this KQL query to list all active tables:
// List all active tables with data in the last 30 days
search *
| summarize count() by $table
| where count_ > 0
| sort by count_ desc- Check Specific Data Connector Tables:
- To check which tables are specific to a data connector, use this query:
// Replace 'ConnectorName' with your specific table such as "SigninLogs" for EntraID)
search *
| where DataType == "ConnectorName"
| summarize count() by $table
| sort by count_ desc
Validating Query Usage on Data Connector Tables
- Query Performance Insight:
- Use the QueryPerformance table to see which queries are running against your data tables:
// Query performance and frequency
QueryLogs
| summarize QueryCount = count() by StatementText, DataType
| where DataType in ("ConnectorTable1", "ConnectorTable2")
| top 10 by QueryCount
Review the results to identify how frequently your data connector tables are being queried and optimize the queries if needed.
There is Another Way!
Remember that you can also use the Azure Portal with Sentinel to review what is connected and what is disconnected, view recent ingestion as a chart, and use a graphical ‘at a glance’ overview.
Head to Microsoft Sentinel in your Azure portal at https://portal.azure.com.

Once in Sentinel, go to Configuration > Data Connectors
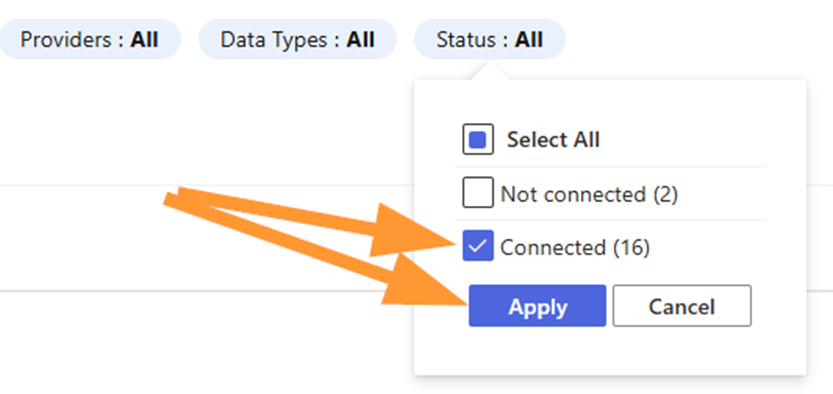
If needed, filter to Status: Connected using the pills near the top

Select your favourite data connector (Yes….the Canadian spelling!)

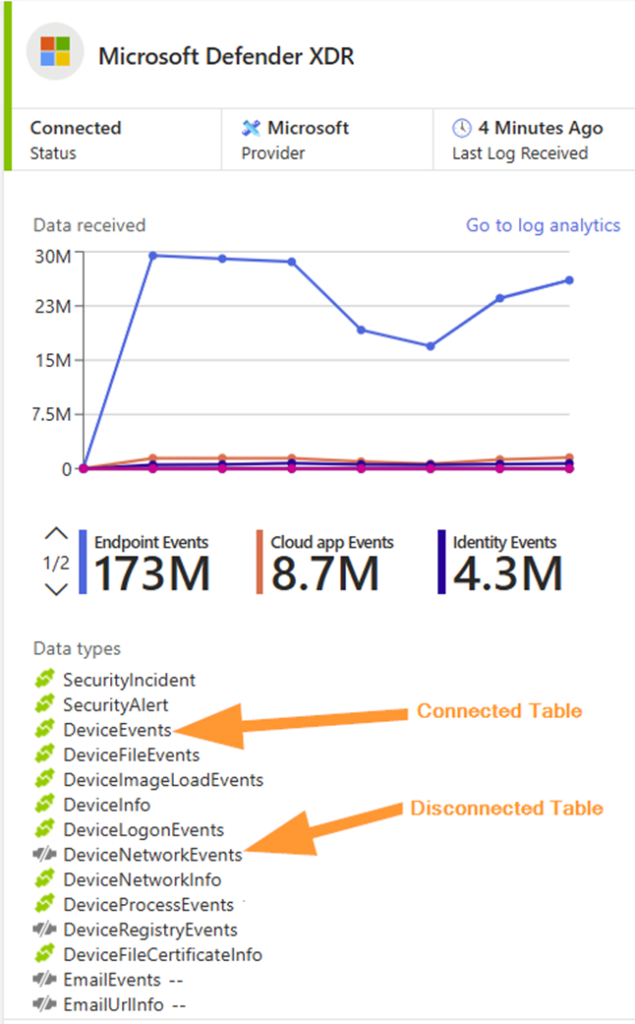
Notice the connected and disconnected tables in this Defender XDR data connector. A table that is grayed out indicates we do NOT have that data flowing in. How can we edit this?
Click on Open Connector Page near the bottom of this same flyout pane on the right of your Sentinel dashboard:

Ensure you review the Prerequisites on the page that loads:

Notice that in my example above, I am not using an elevated account for this demo.
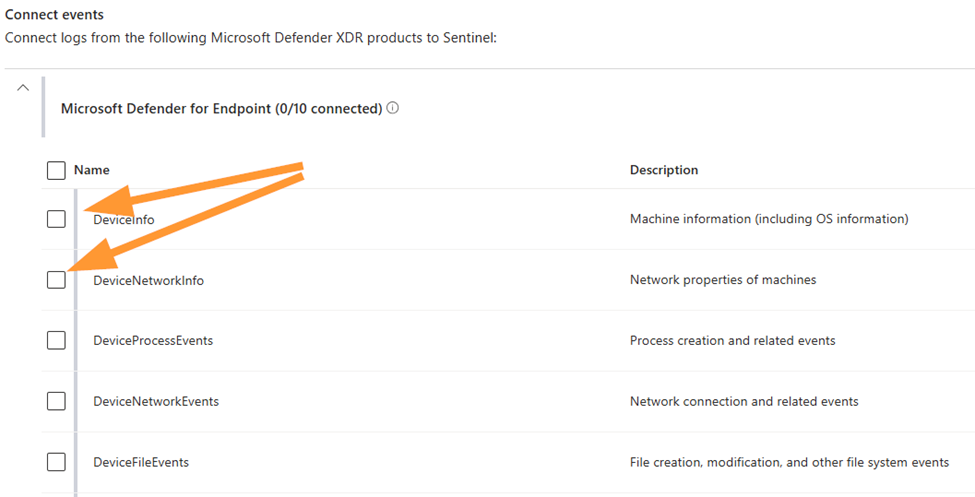
In the Connect Events section, you are able to select either the whole product area (such as Defender for Endpoint), or individual tables:

Save changes when complete. Ensure you have change approvals, or are working in your testing environment.
Summary
Effective data ingestion management in Microsoft Sentinel is a key part of a strong security strategy. By understanding and leveraging interactive and archive ingestion methods, you can ensure swift access to critical data when it’s needed most while keeping long-term processing costs manageable. Balancing analytics and basic logs further refines your approach, offering detailed insights when necessary and cost-effective monitoring for routine operations.
Building specific use cases for your data requirements allows for a more focused and efficient data ingestion strategy. It ensures that every piece of ingested data has a purpose, whether for real-time threat detection, compliance, or historical analysis. This not only enhances your security posture but also makes your security operations more efficient and cost-effective.
Mastering data ingestion in Microsoft Sentinel is about more than just feeding data into a system. It’s about making strategic decisions that align with your organization’s security goals and operational needs. By doing so, you can transform your data from a passive resource into an active asset, driving better security outcomes and providing peace of mind in an increasingly complex digital world.
That covers the essentials of checking a data connector’s ingestion volume, active tables, and query validation!