
Sentinel & Log Analytics – How to Create Incidents to Test with – Part 1
Today, I’d like to talk about using Microsoft Sentinel and address a common question that many teams have when they are starting to work with the Sentinel SIEM/SOAR solution….How do I create incidents to test with? Often this is driven by wanting to test alerts or automations.
A common challenge that teams new to Sentinel often face is running some tests against alerting rules, email notifications, automation rules, and playbooks or logic apps. There are quite a few ways to create some incidents to test with, today we will take a look at using KQL as our source and then expanding on what we can do with our results. We’ll keep things simple, but I will break this into a 2 part article so that we don’t get overwhelmed.
First, let’s get logged into your Azure tenant at https://portal.azure.com and locate your Log Analytics Workspace.
In the top navigation bar search for Log Analytics Workspace. Choose the LAW result and locate your account used for Sentinel testing (We are being non-destructive today, but we should always practice in Non-Prod!).
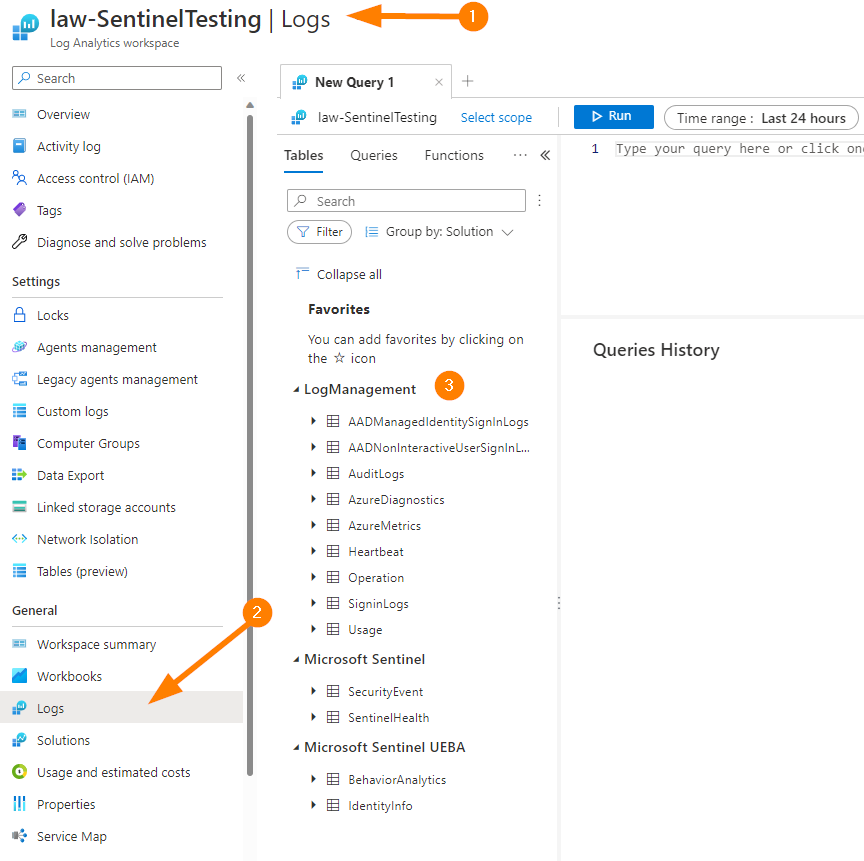
Once in your Log Analytics Workspace, open the blade Logs under the General section. This will load up with a great Queries screen that can provide some excellent pre-populated queries for you as shortcuts to get querying your data quickly.
Let’s jump into our Log Analytics Workspace and start exploring together!
Now we are ready to explore running a query.
To create test incidents for Microsoft Sentinel, you can use pre-existing or create some data points purposefully. For example, you could use data in a pre-existing table in your Log Analytics workspace to pull some events from, and then build an Analytics rule on that query to take other actions such as create an incident and trigger an automation rule or logic app.
Let’s take the query below for example:
SecurityAlert
| where ProviderName contains "MDATP" and Description contains "URL" and CompromisedEntity contains "computername"
| take 10
We can look at some existing data as follows:
| ITEM | VALUE |
| Table | SecurityAlert |
| Column | ProviderName contains "MDATP" |
| Column | Description contains "URL" |
| Column | CompromisedEntity contains "computername" |
| Results Set | Take 10 = Give us 10 results from the table in no particular order |
The results of the above query should give you the following results:
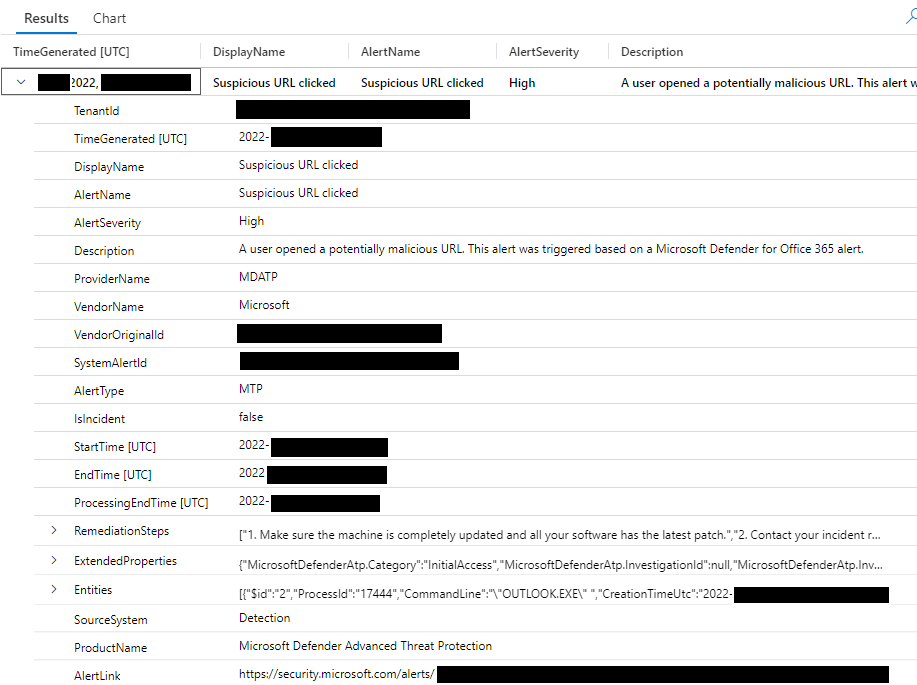
Now, you can change the entity (computer) name and other values to adjust for your existing data. This is for Microsoft for Endpoint data and will work as a great example for us here.
To take this and turn it into a way to create a test incident, let’s go to Microsoft Sentinel in your Azure tenant.
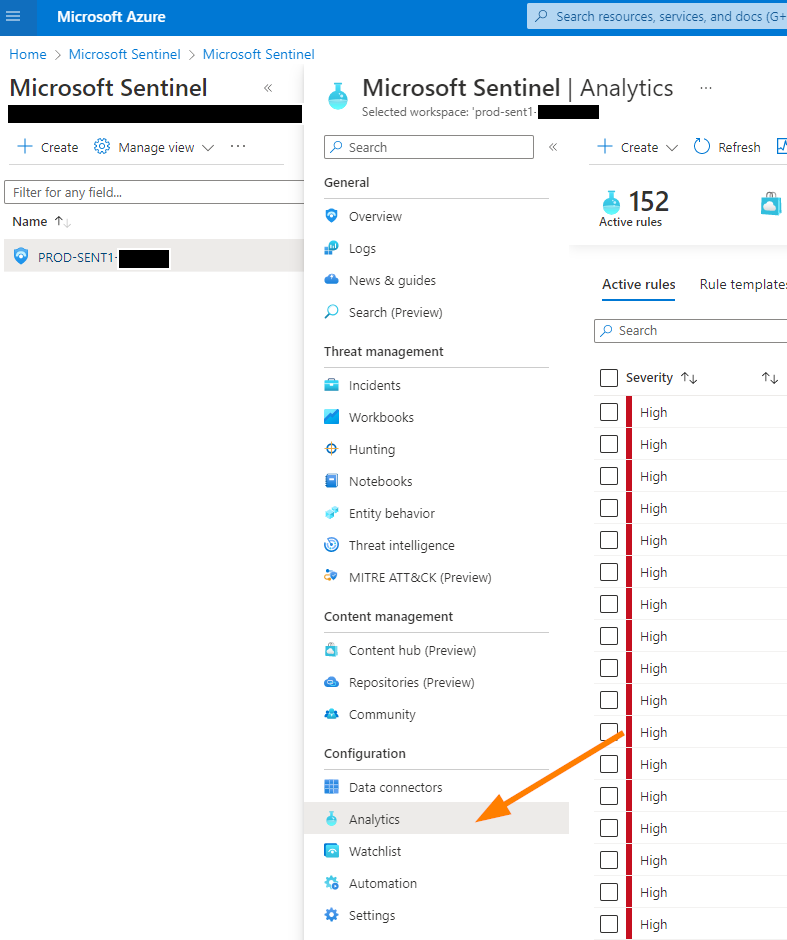
Select your Sentinel instance, and then browse to Analytics.
Near the top, select +CREATE, then choose Microsoft Incident Creation Rule.
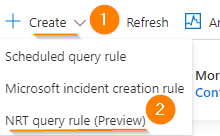
Now we will create a rule that matches some conditions from our test data that we have already confirmed in our Log Analytics Workspace.
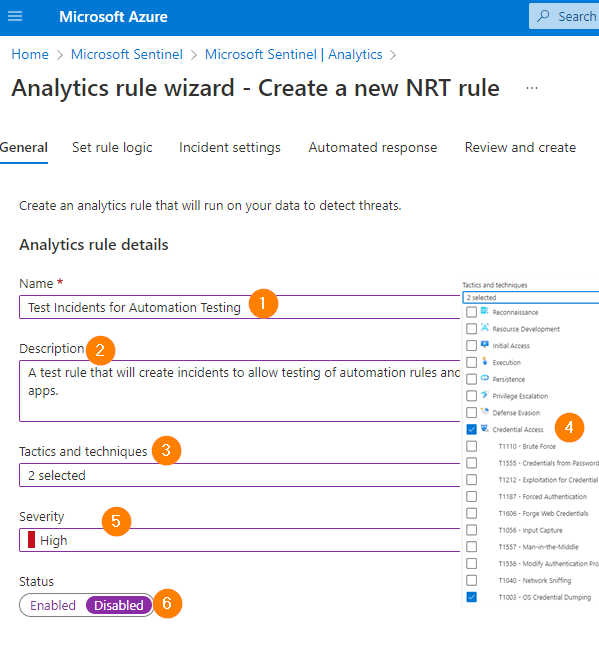
Enter the required name and a good description so that you remember what this rule is for on Monday morning.
Next, set the rule to disabled for now. This will give us a chance to change a few things before we ‘go live’.
Under Tactics and Techniques select what your data is drive by, but for our example I have chosen Credential Access and Credential Dumping tactics.
Next set the Severity to High, and Status of the Rule to DISABLED. This will prevent any accidental tickets as we get ready to being a test cycle.
So, now you can see exactly how we will tag the incident created when we get a match from our query (that part is coming up next). This should hopefully get your wheels turning a bit here — by changing the tactics and techniques details you can really create an incident from anything you would need. In this case, we are using the criteria matched from the KQL query to the incident requirements and filters.
When you click on NEXT, you can see the RULE QUERY screen. Here, we can enter that query (minus the “| take 10” portion) to drive how we can detect an event coming into Log Analytics workspace data and use it to create our incident! This is what many pre-formatted analytics rules do, we are just reaching ‘under the hood’ a bit here to create something manually to test on an exact query result or an action that we take to generate logs and now use that to create an incident so we can control all the triggers and therefore, test our automations!
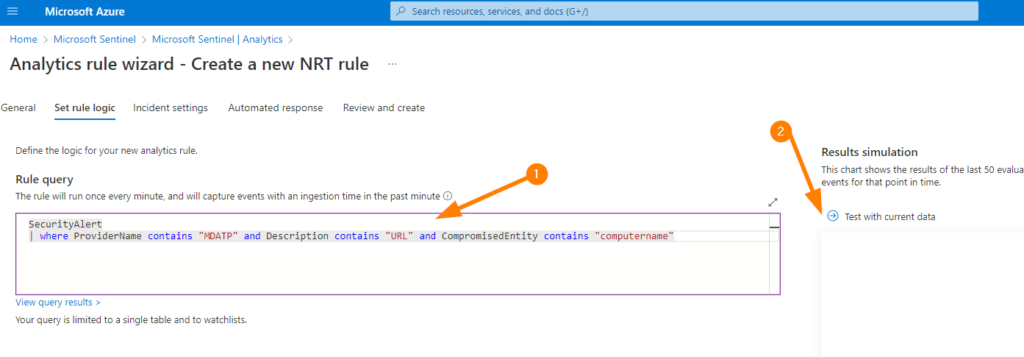
Now Here you can also TEST WITH CURRENT DATA to run a little ‘out of band’ simulation to ensure we are still on the right track. Hopefully you should see the result of your query here, and any rows returned represented in the awesome graphical display with a counter. Note the “Alerts Per Day” counter > this should give you a really good idea of what is going to get generated in terms of incidents into your Microsoft Sentinel incidents queue.
Ok, for the rest of this SET RULE LOGIC blade, let’s get the details filled in so we can create our rule here.
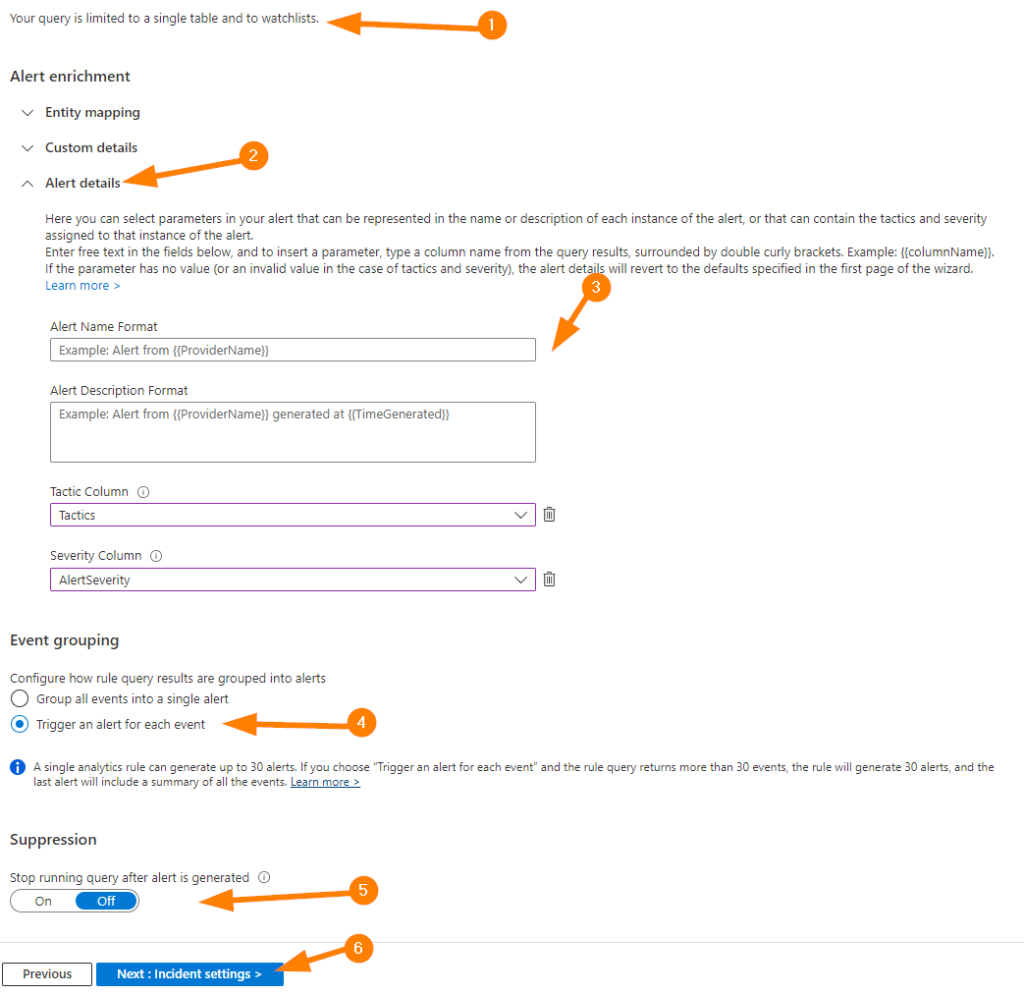
1 – Sentinel let’s us know about how we have really limited our query to a single table and watchlist in this case. Pay attention to this as for testing, this is great; not what we would want to do for a production rule.
2 – Expand Entity Mapping if you need to remap any fields from our results to the new incident that will be created. Next expand custom details and explore how you can change some key values here.
3 – Next let’s expand Alert Details. Now, fill in a nice alert name using some of the provided examples {{columnName}} format to create a fairly clear and well labeled incident. Remember — you may want to throw “TEST” in there somewhere so that our wonderful team members who may see our incident don’t get too excited!
3a – In Tactics Column, choose the field you would like to map, and the same for Severity. May I boldly suggest using Severity to map to our incident Severity 🙂
4 – Under Event Grouping, select “Trigger an alert for each event”. Since our goal is to test on alerts, this will be helpful to us for our use case.
5 – Set suppression to OFF.
6 – Click on NEXT when ready.
On the Incident Settings blade, leave Create Incidents from alerts as enabled. Then ensure Alert Grouping is Disabled.
Click on NEXT when ready to move ahead.
On the Automated Response blade, you will see any automation rules that will trigger as part of your incident being generated. Review these and understand if you disable the automation rules here, they will not execute against anything in your queue. This is not a limited scope.
Click on NEXT.
Review your Analytics Rule details summary and ensure this is what you are targeting.
Note that the rule will be disabled when we created it for our testing purposes. When ready to have this trigger an automation, you link the automation rule to fire when this rule creates an incident, and away you go! We’ll cover that another time coming up.
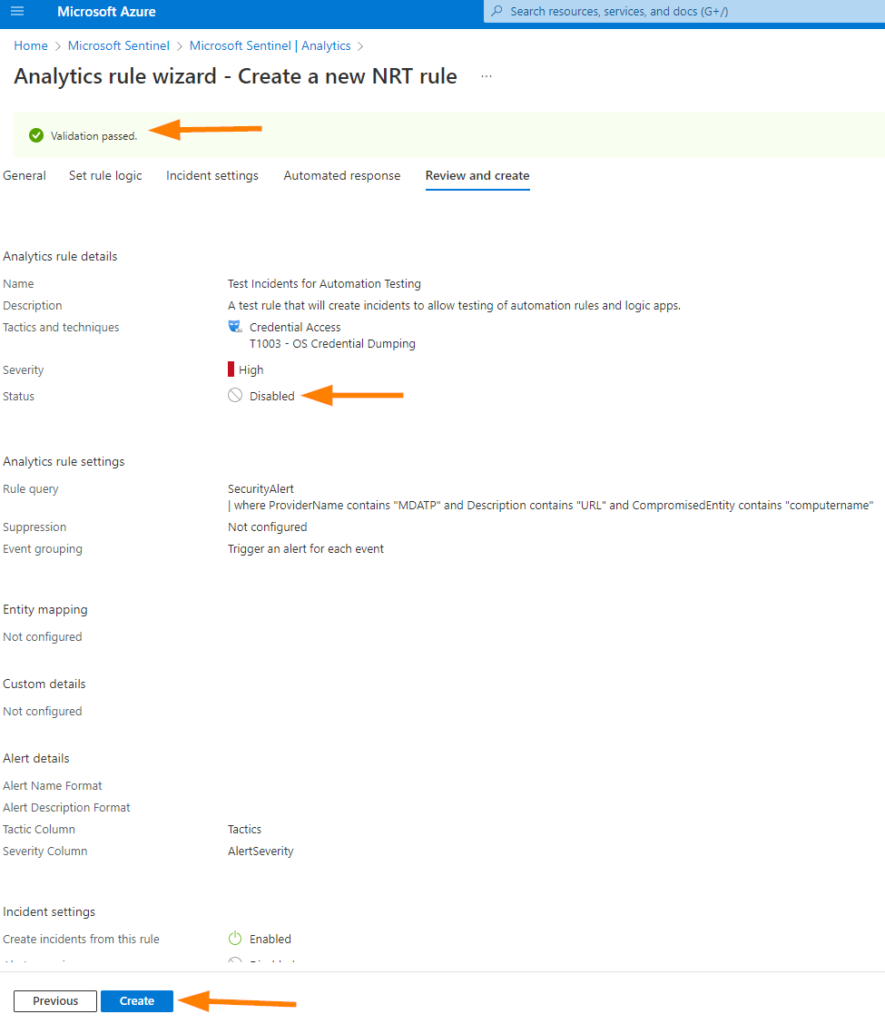
Click on CREATE when you are ready.
On the Active Rules blade of Analytics Rules, you can see the rule you have created by filtering on “test” or another keyword from your title if it was different.
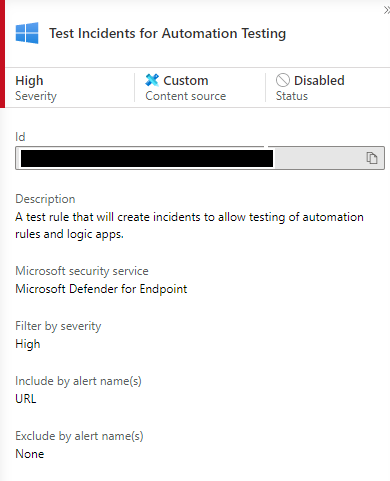
If you select your rule it should look something like this.
Now, I’ve created this rule as disabled for example purposes, you would need to edit the criteria and enable this rule to make it work on different data.