
Using KQL with Azure Arc Machine Status
In this post we take a look at using KQL to observe machine status of Azure Arc managed machines. We will look at a couple of examples of how to create some helpful queries and then using those to enable monitoring in Microsoft Sentinel. As organizations adopt a more cloud-centric management model, it is becoming more common to see machines through Azure Arc, but also our Sentinel log collectors via Azure Monitor Agent are deployed using Azure Arc agent; so we need to make sure we can keep tabs on our log collectors and other servers easily.
In this post we will look at two main examples of how to look for Azure Arc machines that may have issues. Keep in mind as we explore the data, we will focus on the use case of Microsoft Sentinel log collector servers running Azure Monitor Agent (AMA) via Azure Arc. We really want to keep an eye on these systems so that downstream systems sending logs all report and data gets recorded in a predictable manor.
Make sure to log into your testing environment in Azure, or to use Log Analytics workspace log queries only today. If you deploy anything into a production environment it should be planned out and validated….or follow your existing change management process.
Ok, log into https://portal.azure.com like usual and let’s get started!
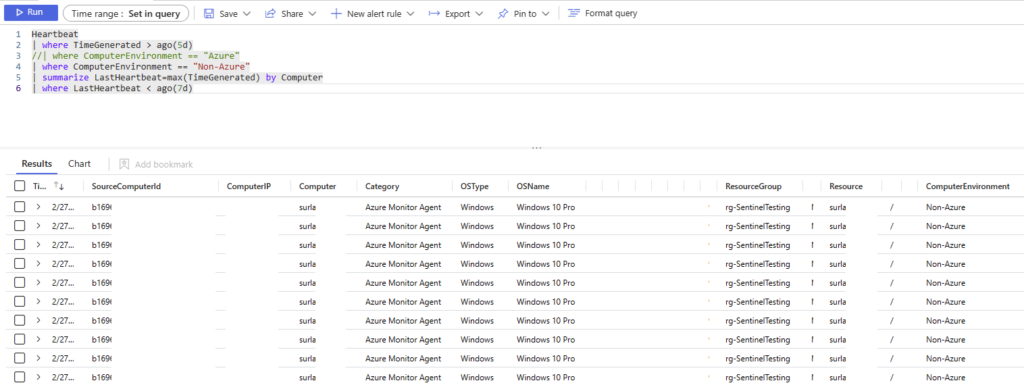
Let’s first look at our use case exception of systems with Azure Arc that are not log collectors:
Heartbeat
| where TimeGenerated > ago(5d)
//| where ComputerEnvironment == "Azure"
| where ComputerEnvironment == "Non-Azure"
| summarize LastHeartbeat=max(TimeGenerated) by Computer
| where LastHeartbeat < ago(7d)
This query will return non-Azure computers from the last 5 days where the Heartbeat is older than 7 days. This is useful for user-type systems in case someone takes a week off. If you run the first few lines above ‘summarize’, then you’ll see something like this:
If you were to include the summarize statement, let’s see what that looks like:
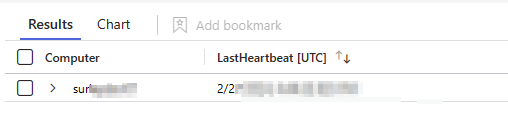
Alright, now the data is summarized so that we see just the lastheartbeat and computer name. In my case of testing data, I have just one computer with a heartbeat older than 7 days.
Relevance for Log Collectors
Now let’s look at the same basic query but oriented for a log collector:
Heartbeat
| where TimeGenerated > ago(5m)
//| where ComputerEnvironment == "Azure"
| where ComputerEnvironment == "Non-Azure"
| summarize LastHeartbeat=max(TimeGenerated) by Computer
| where LastHeartbeat > ago(1h)
The minor adjustments above are a bit tricky to spot if this is newer to your eyes. Let’s break it down:
- TimeGenerated = greater than 5 minutes ago, and
- LastHeartbeat is more than 1 hour ago
This will return results a bit more suited to detecting if a system is sending a heartbeat for us.
More Filtering
More filtering can easily be added such as:
“| where ResourceGroup = “YourSentinelRG”
Heartbeat
| where TimeGenerated > ago(5m)
//| where ComputerEnvironment == "Azure"
| where ComputerEnvironment == "Non-Azure"
| where ResourceGroup == "YourSentinelRG"
| summarize LastHeartbeat=max(TimeGenerated) by Computer
| where LastHeartbeat > ago(1d)
This will filter all computers out that are not living in your Sentinel resource group. Adjust the RG as needed for your own environment of course, but this will narrow down the results significantly if you are using Azure Arc extensively.
Another Way to Find Devices
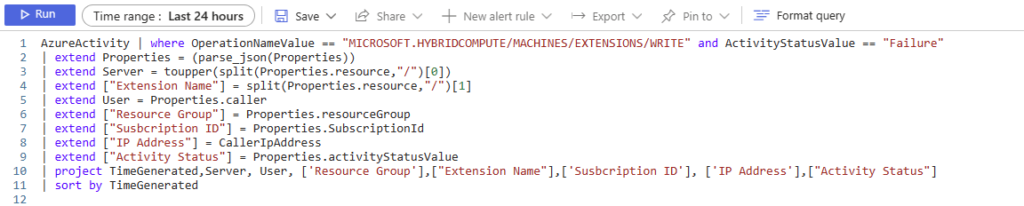
There is always more than one way to find devices with issues in Azure. This time, with Azure Arc, let’s look at the AzureActivity table and where we may also find indicators of issues with devices:
AzureActivity | where OperationNameValue == "MICROSOFT.HYBRIDCOMPUTE/MACHINES/EXTENSIONS/WRITE" and ActivityStatusValue == "Failure"
| extend Properties = (parse_json(Properties))
| extend Server = toupper(split(Properties.resource,"/")[0])
| extend ["Extension Name"] = split(Properties.resource,"/")[1]
| extend User = Properties.caller
| extend ["Resource Group"] = Properties.resourceGroup
| extend ["Susbcription ID"] = Properties.SubscriptionId
| extend ["IP Address"] = CallerIpAddress
| extend ["Activity Status"] = Properties.activityStatusValue
| project TimeGenerated,Server, User, ['Resource Group'],["Extension Name"],['Susbcription ID'], ['IP Address'],["Activity Status"]
| sort by TimeGenerated
In this query we can see that it will return results of devices with a Failure ActivityStatusValue on /Extensions/Write operations. This really means that we will see devices with Azure Arc deployment that failed.
This is helpful because we occasionally need to create new systems to use as log collectors, or we need to deploy to parallel servers to facilitate upgrades and updates. We could also share this query with our good friends working on infrastructure with Azure Arc so they have an easy way to find failed deployments.
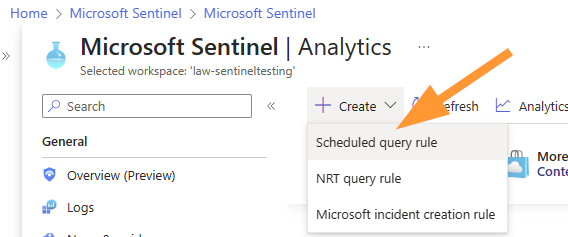
Bring on Sentinel
To bring your query into Sentinel and use it to create an incident when we have results in the query, jump back your Sentinel instance > Analytics > Create New Scheduled Rule.
Next enter a name and description, then choose the severity of your incident.
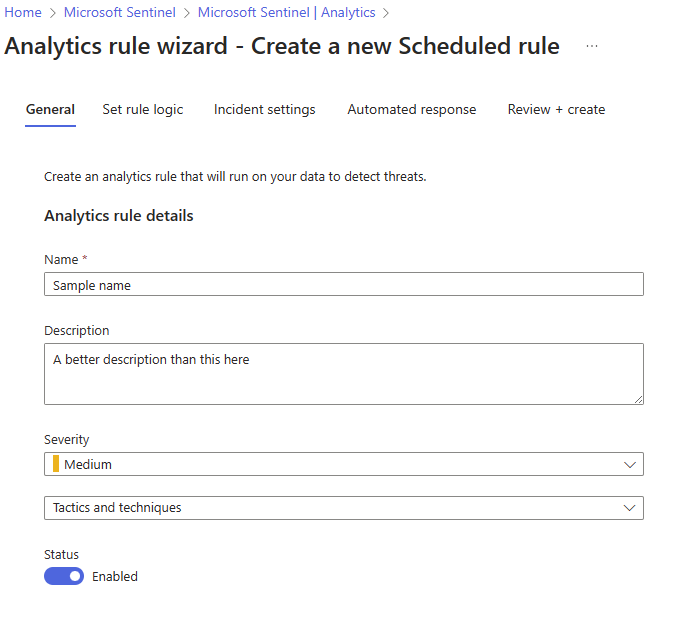
Choose Next: Set Rule Logic.
I prefer this query to keep a close eye on my log collector servers:
Heartbeat | where TimeGenerated > ago(5m)
//| where ComputerEnvironment == "Azure"
| where ComputerEnvironment == "Non-Azure"
| where ResourceGroup == "YourSentinelRG"
| summarize LastHeartbeat=max(TimeGenerated) by Computer
| where LastHeartbeat > ago(1d)
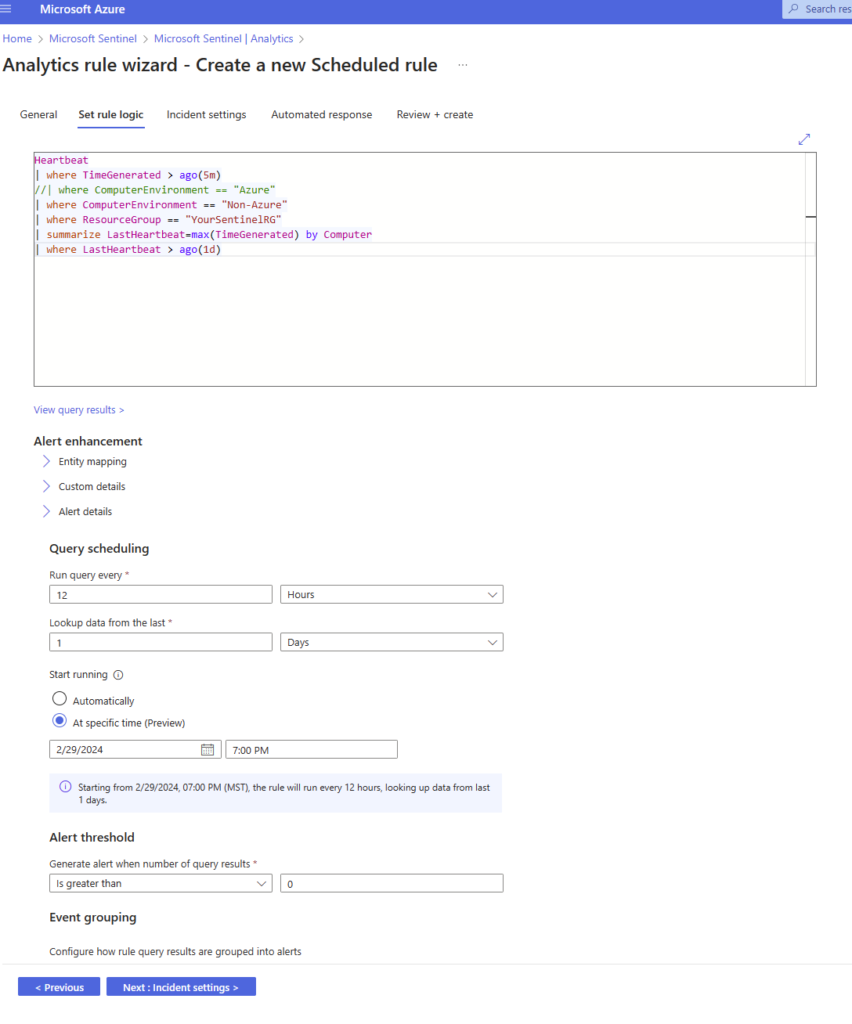
Configure settings that work for your business needs and environment:
- Run query every: 12 hours
- Lookup last: 1 day of data
- Start running: at 7am/7pm (This is just my preference so that my shift-based teams see incidents faster
- Alert threshold: is greater than 0 (zero)
Next > To Incident Settings:
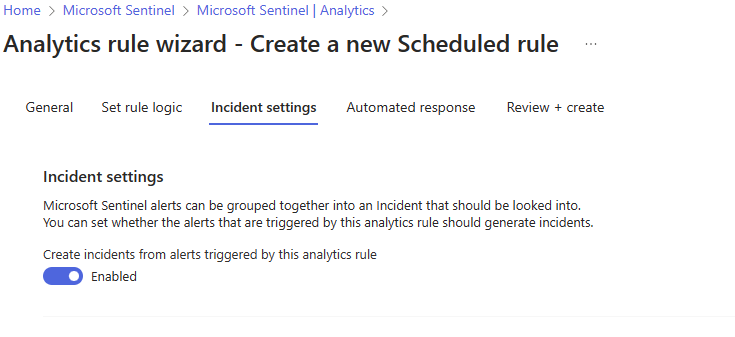
Ensure that Create Incidents is enabled.
Add any automation rules to apply to this Analytics rule and click on Review.
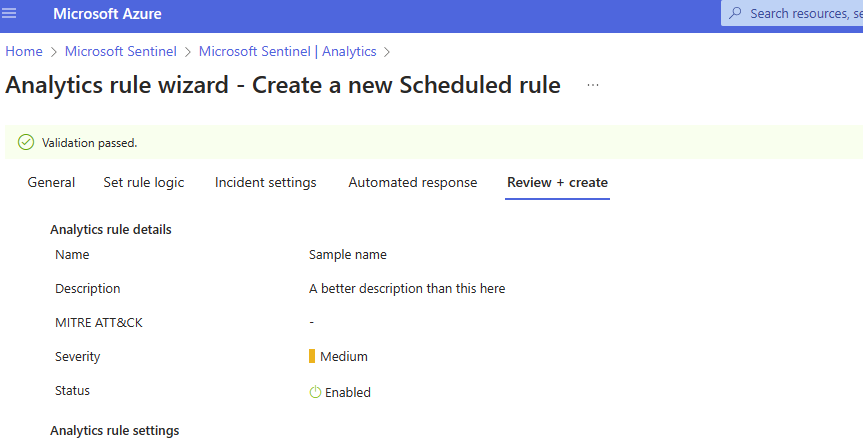
Make sure you are happy with the settings & create!
Conclusion
Done & Done! Congratulations. You are now creating incidents based on detecting heartbeat issues with your Azure Arc enabled servers.
Remember that there is just no substitute for jumping in and exploring your data. It can be a fun & enjoyable afternoon to work your way through some new queries, learn about the results, discover issues hiding in your data, and guess what? …..that is the beginning of hunting!
Thanks again for joining me as we explore our data together, build meaningful and helpful detections in our Microsoft Sentinel environment, and set our tracks to improve our Azure tenant one step at a time!