
Monitor Sentinel Data Connector Health
This week we look at monitoring the data connectors that are deployed in a Microsoft Sentinel instance. There is more than one way to monitor most Azure infrastructure and data connectors are no exception. Today we look at creating a way to keep an eye on your data connectors operations in Sentinel, using Sentinel. Join me for a few minutes as we explore one of the important best practices in Microsoft Sentinel – health monitoring.
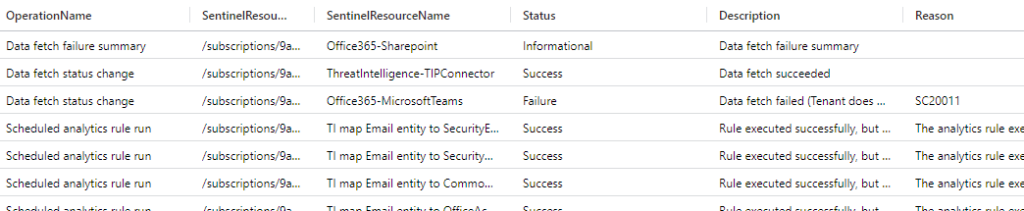
Why monitor Sentinel data connectors? Well, how will you know you are not getting data from a source such as your on-premises firewalls or switches if you don’t monitor?
Sentinel is so easy to use, and the focus is often on deploy and collect. Once your instance or organization makes it to a point where you are collecting the right data; governance should kick in! In this post we explore a nice simple way to get to know some health monitoring data, then we will build some alerting so we can find out when a data connector breaks.
First up, let’s get logged into our testing instance of Sentinel at https://portal.azure.com.
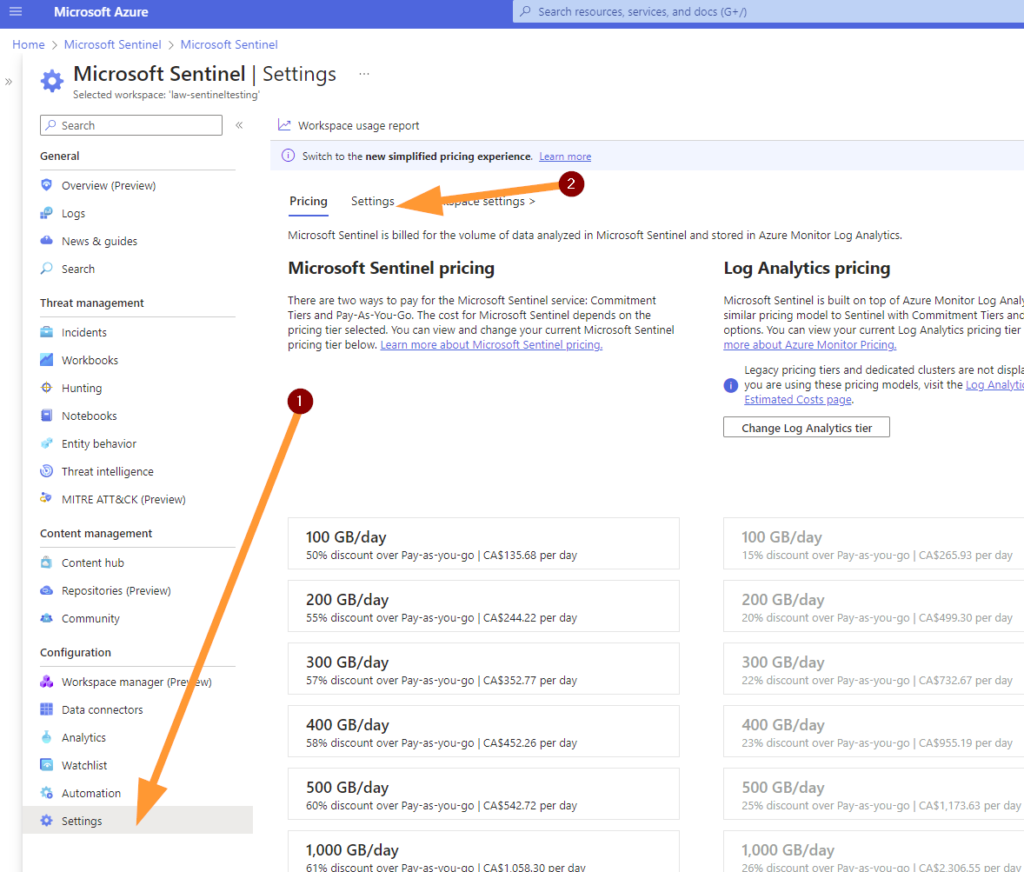
Once you are in Sentinel > head to Settings > then to Settings.
Yes, double-tap the two settings first in the navigation menu, then the tab ‘Settings’ on the ‘Settings’ blade. Go ahead….get that chuckle out of your system early this time :).
Next, scroll down to the “Auditing and Health Monitoring” section. Some sections may be expanded already when you load this blade, so don’t worry if yours looks a bit different here.

If you do not have Health Monitoring enabled, let’s do that first:
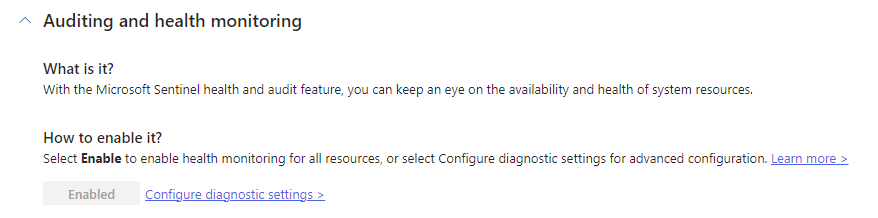
If you health monitoring is already enabled you’ll see something like shown above here. Otherwise it will look like this:

If you would like detailed instructions on enabling the built-in health monitoring functionalities, find that here: https://learn.microsoft.com/en-us/azure/sentinel/enable-monitoring?rtc=1 . Next, we will follow the configuration advice and click on CONFIGURE DIAGNOSTIC SETTINGS. As a professional working in Sentinel, you will see diagnostic settings frequently so please do take a few minutes and read-up on how to configure and where to point these settings logs.
HINT:
Diagnostic settings need to be pointed at your Log Analytics Workspace in most cases. This will allow your Sentinel instance to examine those logs and take steps based on threat intelligence and other logic that we craft.
On the Diagnostic Settings page from within Sentinel, next you can EDIT your existing diagnostic setting or if one does not exist you should create a new one by clicking on ADD DIAGNOSTIC SETTING.

Now you should see something similar to this:

- Ensure under LOGS to select allLogs. This will give us the logging health data we need to support keeping Sentinel healthy.
- Select Send to Log Analytics Workspace.
- Choose the subscription.
- Choose the Log Analytics Workspace you are using for your Sentinel instance. This is important.
- Save your changes.
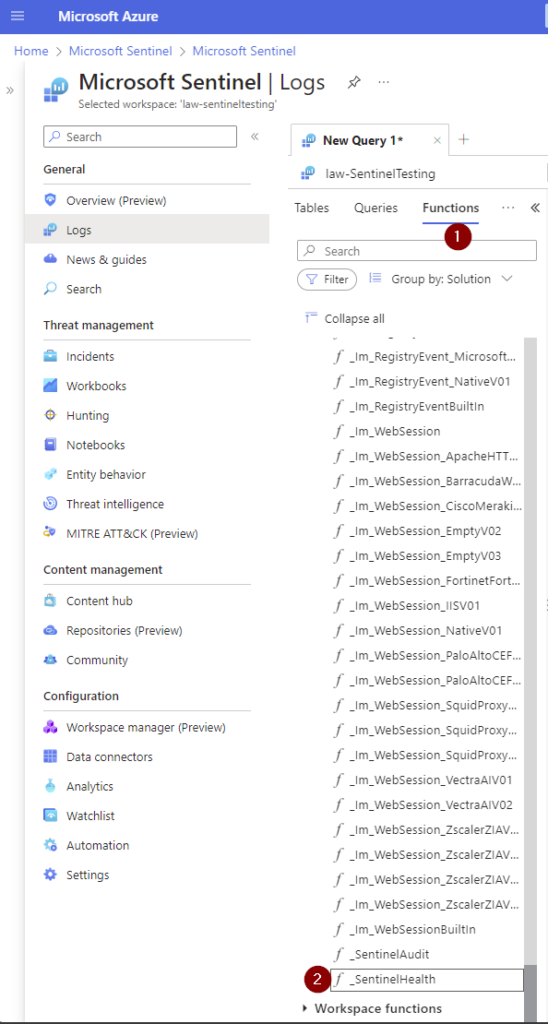
After a few minutes of Sentinel running operations in the background, you should see a new table pop in about here in your Log Analytics Workspace:

We will now begin looking at the SentineHealth table to get our data, but you should also know that when the Health functionality is enabled you get a free function:
What does this function do you may wonder to yourself?
I like to explore and see what things do and how they work….so this part can be skipped if you don’t find the ‘under the hood’ concept interesting!

Hover over top of the function _SentinelHealth to see the above pop-up > then click on Load the function code. Prepare to be astonished with complexity!!
Well, maybe not so much…..
You can see that the function actually just queries the table directly! This is good though because it allows the table name to change in the future and minimizes impact in the future. Although I do wonder why bother on this one…..that said, we will start to look at our data by querying directly against the table SentinelHealth.
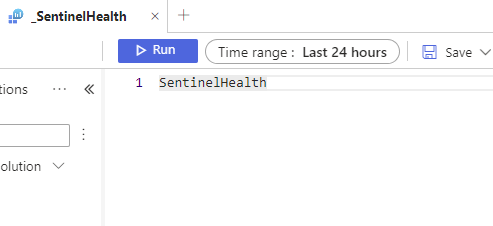
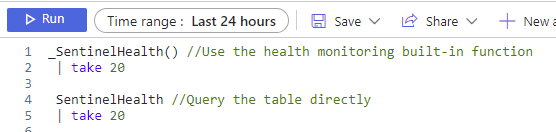
To use the function, you can run this:
_SentinelHealth() //Use the health monitoring built-in function
| take 20
This will return a random 20 rows from the table for us. We get a rather random sampling of the data available, which is good. This let’s us explore what is in the results a bit.
Now, what if we query the table directly?
SentinelHealth //Query the table directly
| take 20
The query looks pretty similar — it really is in this case.

First off – notice how the results between the two queries return different rows? That is because of that ‘take’ command. If you want to know more about that check this out here: https://learn.microsoft.com/en-us/azure/data-explorer/kusto/query/take-operator.
We took a quick look at all the data coming back from our simple queries, and used the built-in function, and now we will get ready to create a more refined query to help monitor in the next post here on AzureTracks.com.
Our queries used so far were:
Join me for the next article where we will refine our monitoring query and create a way to alert us when a data connector is failing!
asdfasdf