
Monitor Sentinel Data Connector Health – Alerting
This week we continue our look at monitoring the data connectors that are deployed in a Microsoft Sentinel instance. This article shows how to take Sentinel heath status data and create an incident in Sentinel so we can address the problems.
There is more than one way to monitor most Azure infrastructure and data connectors are no exception. Today we look at creating a way to keep an eye on your data connectors operations in Sentinel, using Sentinel. Join me for a few minutes as we explore one of the important best practices in Microsoft Sentinel – health monitoring and create incidents based on data connector health exceptions.
RECAP
Why monitor Sentinel data connectors? Well, how will you know you are not getting data from a source such as your on-premises firewalls or switches if you don’t monitor?
Sentinel is so easy to use, and the focus is often on deploy and collect. Once your instance or organization makes it to a point where you are collecting the right data; governance should kick in! In this post we explore a nice simple way to get to know some health monitoring data, then we will build some alerting so we can find out when a data connector breaks.
First up, let’s get logged into our testing instance of Sentinel at https://portal.azure.com.
Once you are in Sentinel, let’s review what we covered in the first article:
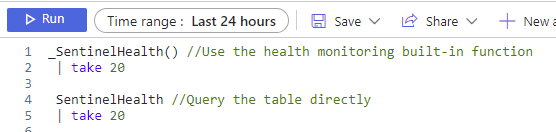
The two queries we started to explore our health data with were:
Let’s get to Work
Head to Sentinel > Logs and get ready to query! You can queue up the queries from the last post against the SentinelHealth table to refresh your memory, or you can dive right in!
First things first.
Our queries so far are pretty general and not helpful to tell us only about errors. Let’s try something here:
SentinelHealth //Query the table directly and apply filters
| where Status != "Success" and Status != "Informational" and SentinelResourceType == "Data connector" //Return only data connector errors
Now this little 2 line query is much better!
First of all, it returns only the problems that we are interested in with data connectors, and removes all the noisey entries that equate to an ‘everything is ok alarm’ in my mind. We really just need to know about the problems today.
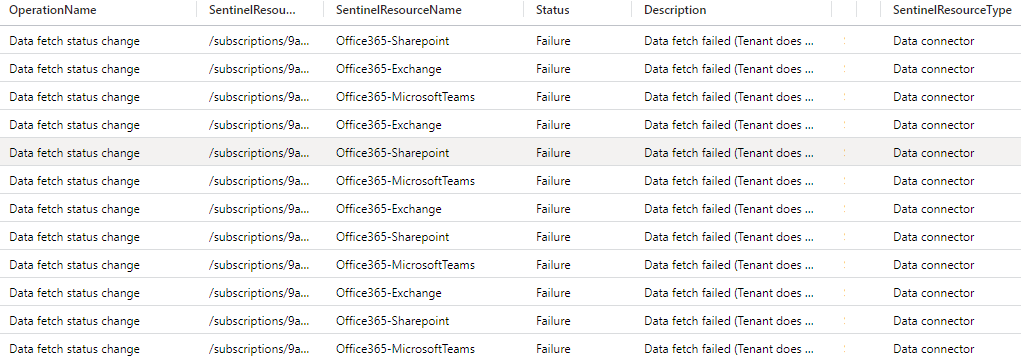
The data returned is all for data connectors and you can pretty plainly see that I broke the Office 365 connector on purpose here to generate some testing data for us to work with!
Now….there is a cool feature that we can use to quickly create an Analytics Rule. We won’t use this every day, but it’s good to know about.
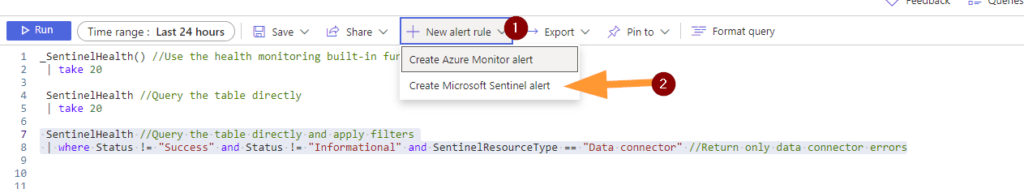
First, highlight that last query we used > then click + NEW ALERT RULE > next choose CREATE MICROSOFT SENTINEL ALERT.
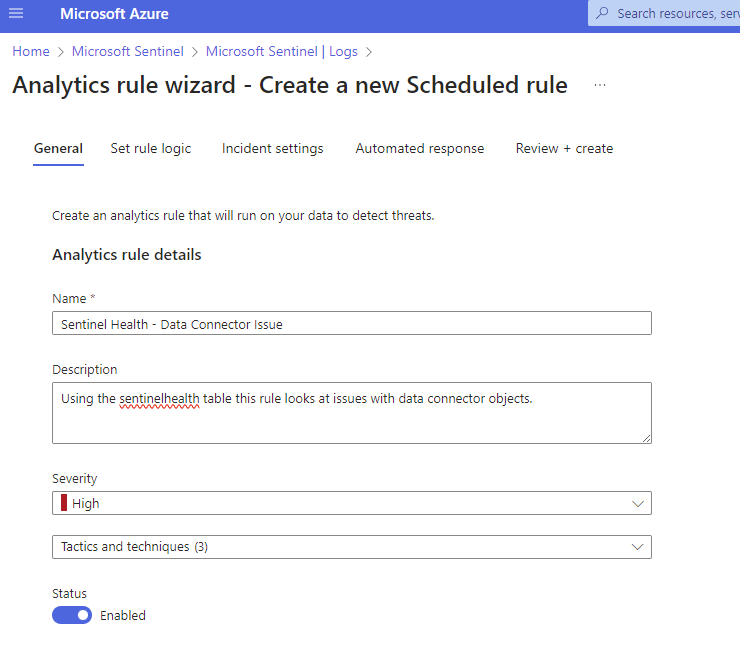
You should see a very familiar Azure blade to create a new Analytics Rule.
Enter a meaningful name and description, I like to standardize naming a bit to make it clear what the rule is about so the next SOC team member is not wonder what rule 8YhNr6 is….I have seen encoded rule names before and it should not be a thing. Ahem…you know what to do if this used in your environment.
I change the Severity to HIGH because without data we are going to be in trouble quickly.
Next, I do select a couple of relevant MITRE Framework tactics, please feel free to choose what is relevant and click on NEXT.
Your KQL should be in the RULE QUERY field, update it if needed, let it validate, then use the EXCELLENT feature on the right side RESULTS SIMULATION.
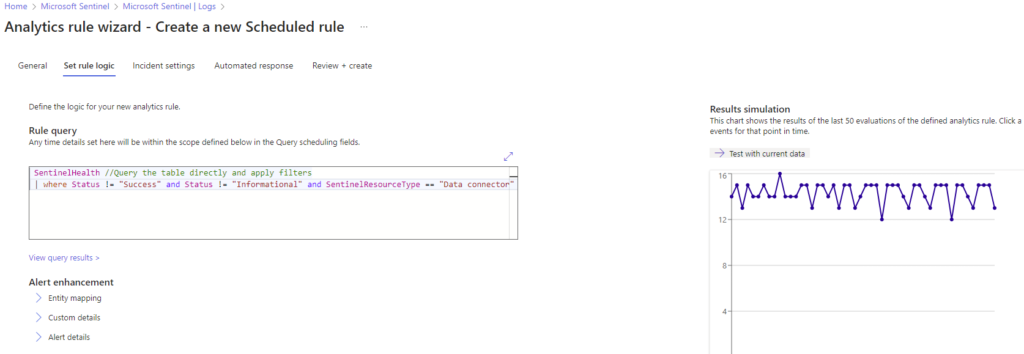
We can see that the results are returning a good count based on our data exploration earlier, so we can continue configuring our alerting rule here.
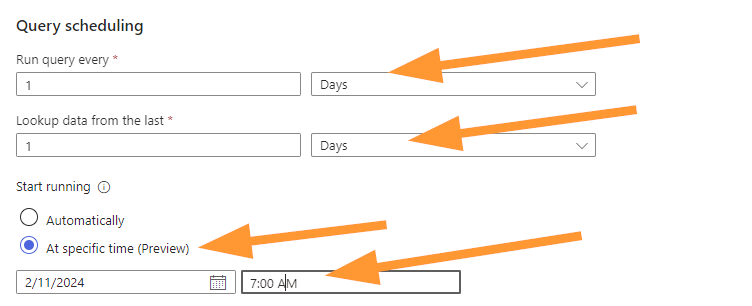
Select your scheduling options, now you should match these to your business requirements for your organization or client. I’m setting this to run once per day, look at the past 1 day of data, and schedule this to run every day at 7am.
Why schedule for 7am?
I chose this because often the day shift, or only shift, starts in the morning. Wouldn’t it be nice to know about any data problems from overnight right away? I thought so too! The thinking here is that if this rule triggers daily at the start of the day then we will know about data connector errors quickly and be able to resolve them sooner.
Now, move to the ALERT THRESHOLD section and ensure that you choose ‘Is greater than’ ‘0’ as your options:
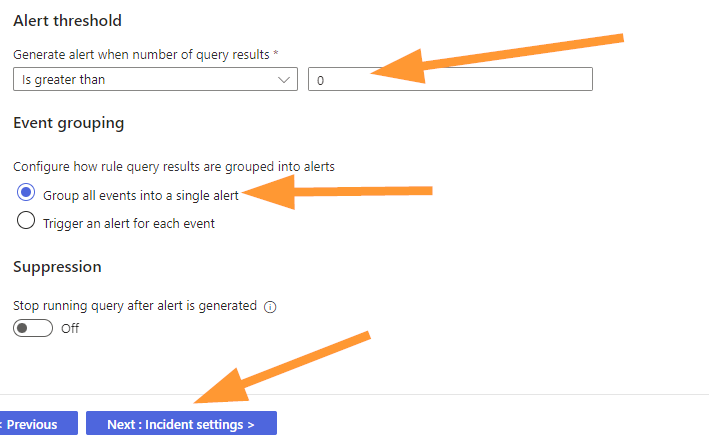
The default is to group all events into a single alert, let’s leave that alone and choose NEXT.
Ensure that ‘Create incidents from alerts’ is Enabled:
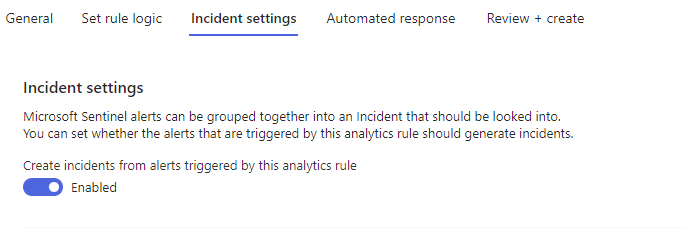
Choose NEXT.
Select any Automation Rules or Playbook automations you wish to map to this, today we will choose NEXT here.
Now the new Scheduled Rule should validate happily for us and we should see something like this:
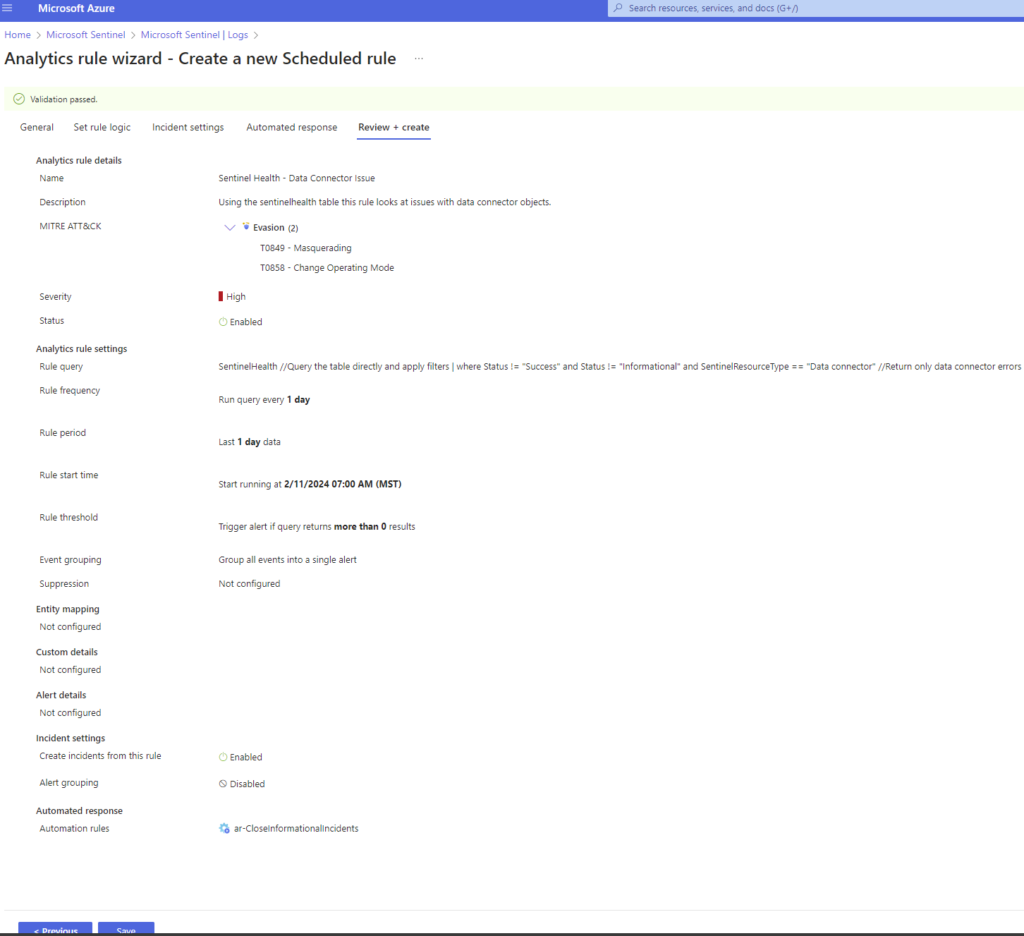
That’s a big screenshot, but take a look and notice the MITRE Evasion techniques that might apply here for this as an attack technique.
Check your settings & create!
GO TEAM!
Hop over to ANALYTICS. Refresh the rules and find our new rule.
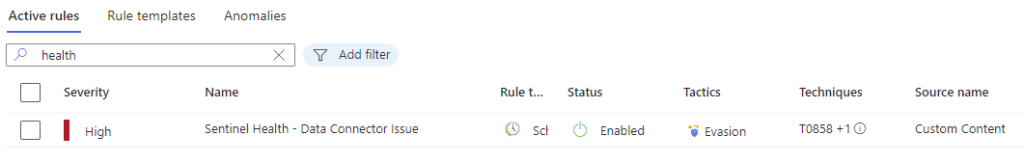
Select the rule to see the details:
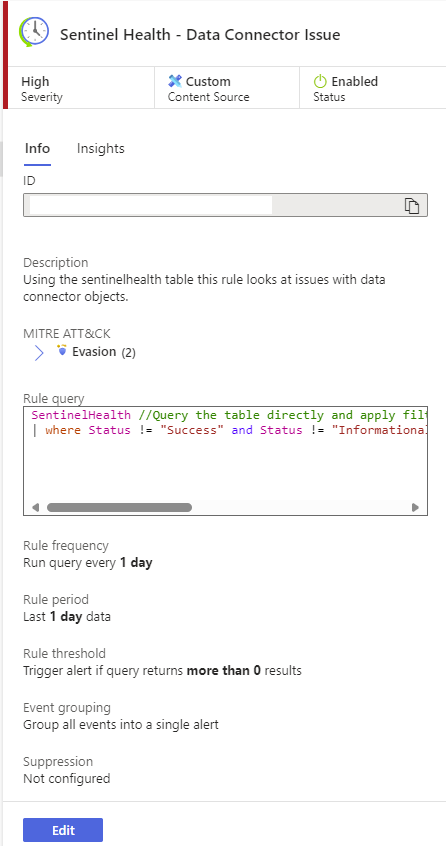
Notice that your rule should be enabled, the parameters should match the configuration you just set, and life is good!
Hopefully you don’t see any actual errors in here, but this rule will now tell your team about it when it happens so it can be fixed in good time!
Thank you for joining me for this post here on AzureTracks.com. I can’t wait to see what we have coming up next post!
Happy Hunting!