
Microsoft Sentinel Governance Deep-Dive
Today, we continue our mini-series looking at Sentinel Governance tasks that we can do to keep our favourite SIEM/SOAR solution working smoothly to detect attacks and providing visibility into threats to our environments. Sentinel is like having a superhero team that protects your enterprise from cyber threats! 🦸♂️🦸♀️
Just like how superheroes have different powers and abilities, Sentinel governance has different components that work together to keep your enterprise safe. It’s like having a team of Iron Man, Captain America, and Black Widow all rolled into one! 💪
If you missed the first introduction article to Sentinel Governance, you can get caught up right here!
Last post I talked through some of the basics to get your Sentinel workspace tuned up using some basic steps that will work for most SOC teams. This post will build on top of that baseline and dive into some of the additional background work we can do to really tune our workspace and optimize our Sentinel resources. Let’s jump right in!
Analytics Rules
Reviewing existing Analytics Rules can quickly show you (in the Sentinel dashboard) if there is an update available. First, check your existing rule to see if it is customized. If it is, save your customizations such as changed KQL queries and settings; then proceed with the update. Something really fantastic about this update process is that you will be shown the differences between your existing and new rule as you begin the update process. I tend to be more cautious and typically back up my rule code first; but that’s just my own preference. Let’s expand this all out so we can see the details involved here.
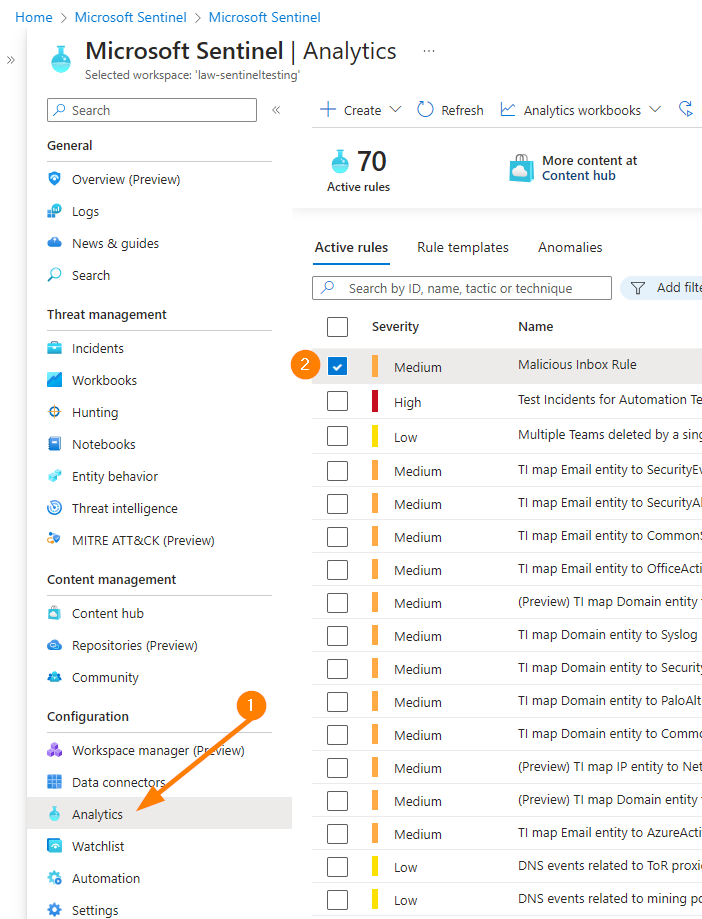
To look at the KQL in your Analytics rule, first get logged into your Azure environment and head to your Sentinel instance. Next, select Analytics and choose the rule you want to back up or update the KQL for:
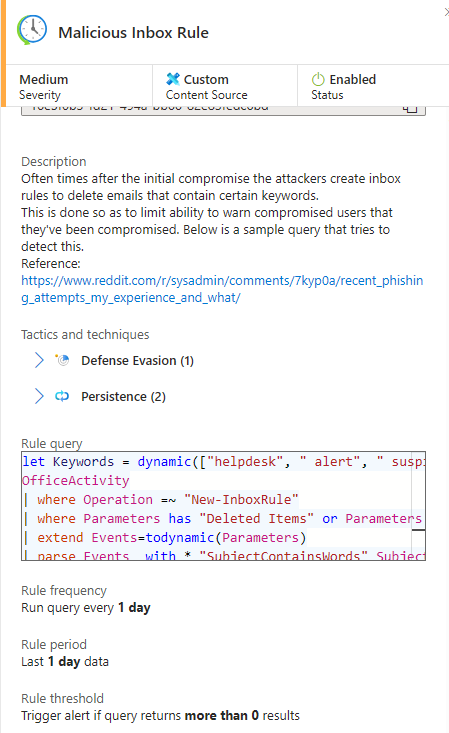
On the right side of your dashboard a new blade will load, select EDIT from your Analytics rule here:
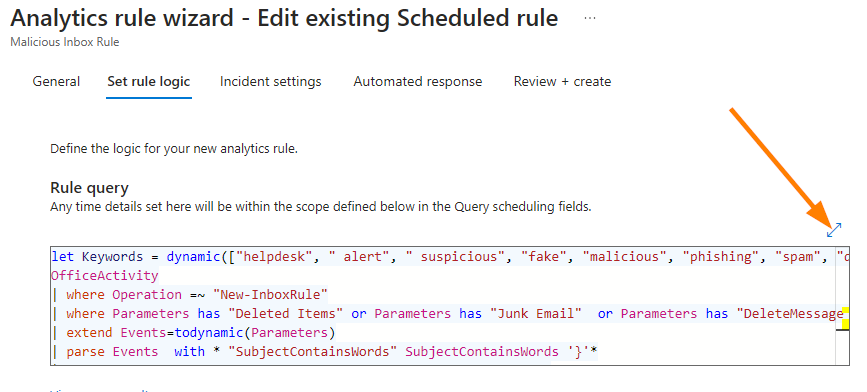
Now a new dashboard loads, select the SET RULE LOGIC tab:
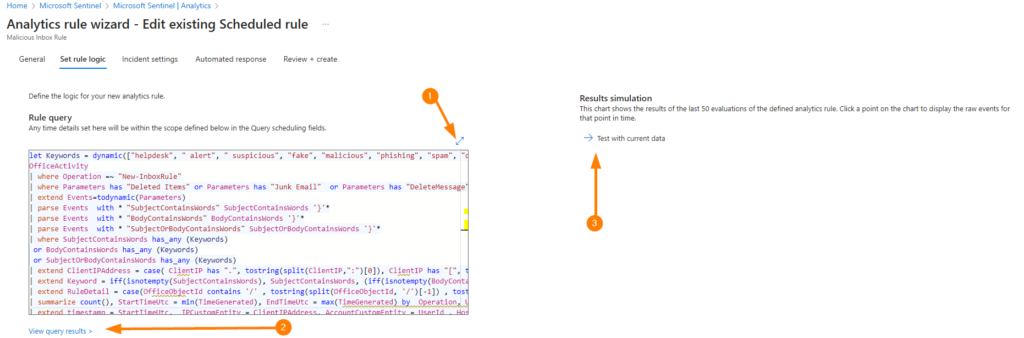
When the rule logic tab loads, the first thing I like to do is validate that the KQL is working by:
1. Make the code frame larger to view it better.
2. View query results which gives me the Log Analytics code view and validate the results.
3. Test with current data which lets me check the code against the last 50 triggers of the Analytics rule.
The method to backup from here is easy – copy and paste your rule code into any system you like to keep an archive. I personally use OneNote because it is easy to share with my team members, control access using RBAC, and it automatically cloud syncs which keeps me covered! Easy right?
Let’s take a little look at the update process:
When an Analytics rule has an update available, it looks like this in the dashboard:
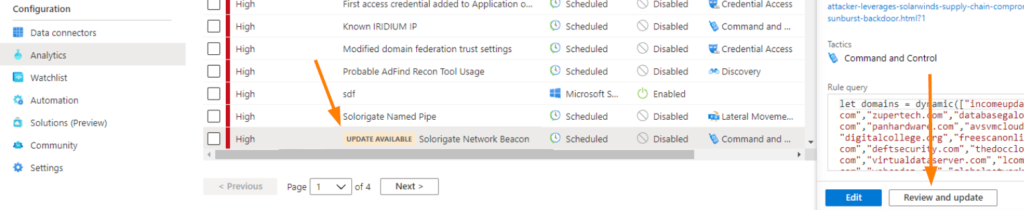
Pro Tip!
The UPDATE AVAILABLE banner is there to let us know that the rule needs an update to work with current conditions, table column names occasionally get updated and vendor data gets those same updates. Sometimes a vendor adds new fields or columns to data connectors and logs, and we need these updates to both properly evaluate and work with data, and make sure that our rules are detecting threats as intended.
Click on REVIEW AND UPDATE to see a comparison of the old vs new code. This is also a great place to copy the old code out to archive it!
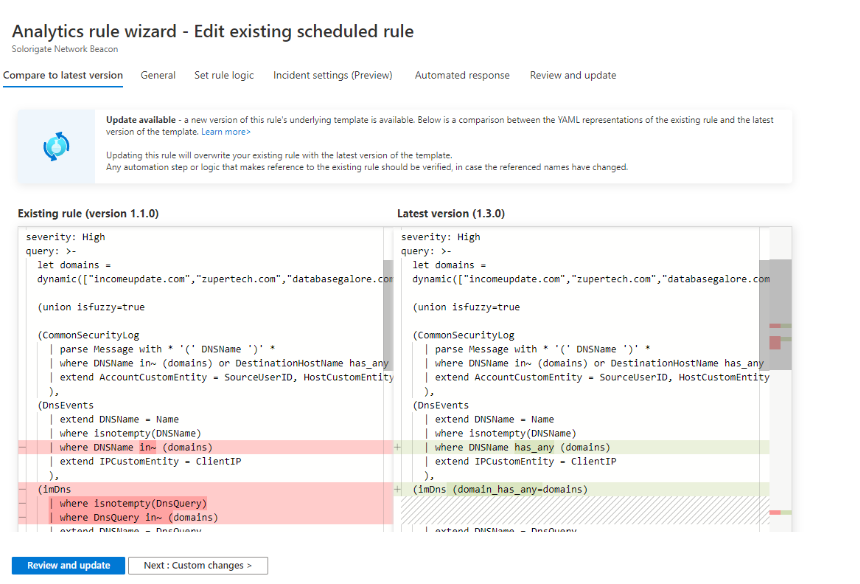
If you want to review other details of the update change, you can make CUSTOM CHANGES, or you can click on REVIEW AND UPDATE to update to the new code. These updates are definitely a key governance component to keeping your Sentinel instances tuned up!
Pro Tips!
- Make sure to update any Analytics rules that need published updates from partners or Microsoft.
- If you have custom rules (who doesn’t!), then you will want to review them on at least a twice per year basis.
- For custom rules, there is usually no button to just click and update. You will need to update your KQL.
- These updates are a big part of why a good governance process includes backing up your KQL code as part of your update process!
How Often is an Analytics Rule Running?
There is a shiny new feature (In Preview as of the writing of this post) called “RULE RUNS”. This lets you quickly see a summary of the last 7 days of executions of a selected rule.
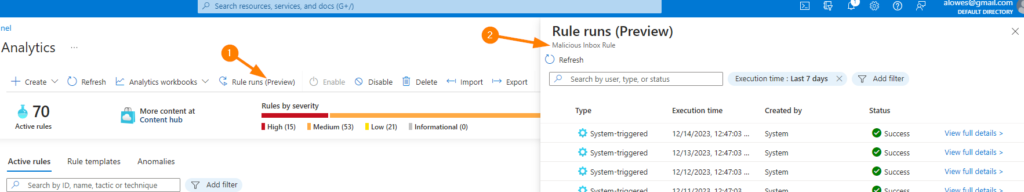
As part of our governance tour, a big part of understanding how Sentinel is doing ‘under the hood’ is understanding the health of Sentinel tooling that we have implemented. To take a look at this table. We’ll touch on this in a couple more thoughts…..
Here you can see that our Rule Run details show us that there were no malicious inbox rules detected and therefore did not trigger our rule to perform it’s other settings > create a Sentinel Incident, disable the Inbox Rule, etc.
Let’s talk Sentinel Health
Alright! So now we’re getting down to some of the more fun governance tasks in Sentinel! (Wait….is it possible to have fun with governance?) Honestly, if you’ve dedicated the time to come this far in the post and you are truly interested in keeping your Sentinel instances in top shape….yes…you too enjoy what you do and you may actually be enjoying yourself 🙂 Congratulations! You reached an awesome thing in life where work is also really fun. Enjoy!
Back to the task at hand.
Let’s talk for a moment about how we can also monitor our Sentinel Analytics rules so that we get an early detection of when any issues are happening with queries, integrations, automations or other conditions that can cause a rule to not behave as we intended.
- Head to your Sentinel Log Analytics Workspace.
- Open Logs
- Note the tables that are available to query against.
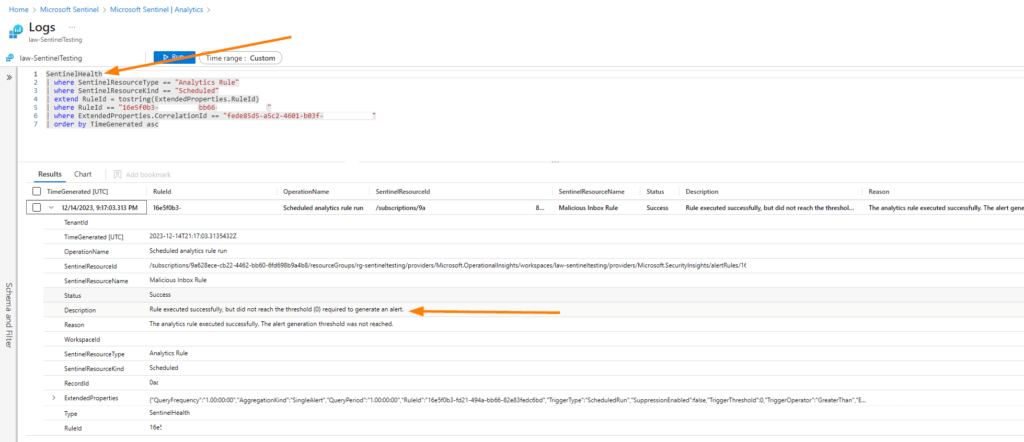
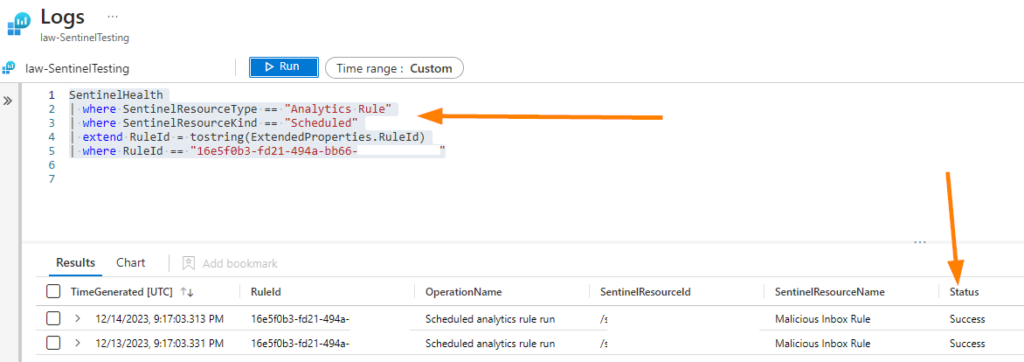
Since Analytics rules are really just an object, we can take that RuleID and find out some additional information about what’s under the hood here. Try the following query, substituting your own RuleID:
SentinelHealth
| where SentinelResourceType == "Analytics Rule"
| where SentinelResourceKind == "Scheduled"
| extend RuleId = tostring(ExtendedProperties.RuleId)
| where RuleId == "16e5f0b3-fd21-494a-bb66-xxxxxxxx"
Ok, so now you likely discovered that your Analytics rule has some other data supporting the run history:
Now try the following query, again substitute your own RuleId:
SentinelHealth
| where SentinelResourceType == "Analytics Rule"
| where SentinelResourceKind == "Scheduled"
| extend RuleId = tostring(ExtendedProperties.RuleId)
| where RuleId == "16e5f0b3-fd21-494a-bb66-xxxxxxxx"
| where Status != "Success"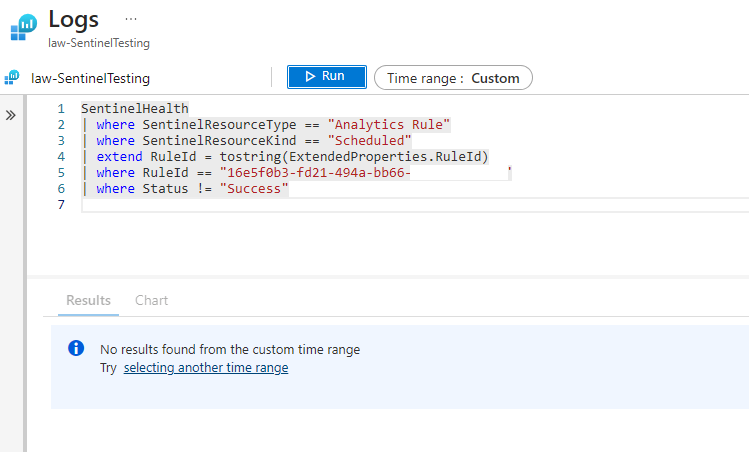
Now, notice that in this case there is no data returned because all runs have been successful.
Let’s build a query to create some internal rule monitoring here:
SentinelHealth
| where SentinelResourceType == "Analytics Rule"
| where SentinelResourceKind == "Scheduled"
| extend RuleId = tostring(ExtendedProperties.RuleId)
| where RuleId == "16e5f0b3-fd21-494a-bb66-xxxxxxxx"
| where Status != "Success"
| where TimeGenerated >= ago(24h)
So now you can take this code, customize it as needed, and create a way to monitor when your rules are not operating perfectly!
Pro Tip
Creating an Analytics Rule to monitor other critical rules is a great way to get fast alerts that something is wrong. Try setting the rule to trigger hourly, or at the cadence that is right for you.
You can monitor critical detection rules this way, but there is an even more efficient way to monitor everything all at once, let’s take a look in our next section together.
Monitor Overall Sentinel Health Conditions
To monitor Sentinel’s overall health in an efficient way, Microsoft has shared queries and methods with us directly to accomplish this: https://learn.microsoft.com/en-us/azure/sentinel/monitor-data-connector-health.
Let’s dive into the tidbits that I find very helpful for overall governance of Sentinel.
First up, monitoring data connectors is critical business for any SOC or SecOps team. I tend to want to know when a data connector changes from HEALTHY to FAILURE as this indicates a connector that was in a good working state that has changed; even if it self-resolves quickly, I want to know about it.
First, check out the link just above here or you can copy the query here:
let lastestStatus = SentinelHealth
| where TimeGenerated > ago(12h)
| where OperationName == 'Data fetch status change'
| where Status in ('Success', 'Failure')
| project TimeGenerated, SentinelResourceName, SentinelResourceId, LastStatus = Status
| summarize TimeGenerated = arg_max(TimeGenerated,) by SentinelResourceName, SentinelResourceId; let nextToLastestStatus = SentinelHealth | where TimeGenerated > ago(12h) | where OperationName == 'Data fetch status change' | where Status in ('Success', 'Failure') | join kind = leftanti (lastestStatus) on SentinelResourceName, SentinelResourceId, TimeGenerated | project TimeGenerated, SentinelResourceName, SentinelResourceId, NextToLastStatus = Status | summarize TimeGenerated = arg_max(TimeGenerated,) by SentinelResourceName, SentinelResourceId;
lastestStatus
| join kind=inner (nextToLastestStatus) on SentinelResourceName, SentinelResourceId
| where NextToLastStatus == 'Success' and LastStatus == 'Failure'
You can create a rule in Azure Monitor or use an Analytics rule to monitor for the failure state condition every 12 hours (this time is set in the query, so make sure you align query time to schedule frequency!). This will create an incident for you or an alert via Azure Monitor, depending on where you prefer to setup this monitoring rule. I actually like to keep it all in Sentinel, that way my team can keep on top of any issues right away. In my world, an email is just another alert email and it’s likely to get sorted to a folder!
How can I monitor All the Analytics Rules?
Who knows the answer to this already? It likely has something to do with KQL! That’s right, it’s a query that can tell us about the status of our rules!
SentinelHealth
| where SentinelResourceType == "Analytics Rule"
| where SentinelResourceKind == "Scheduled"
| where Status != "Success"
| where TimeGenerated >= ago(24h)
The above query returns results based on the following:
- The resource must be an Analytics Rule
- It must be scheduled – meaning it must be enabled and set on a schedule (disabled rules need not apply!)
- Where the status of that rule run was something that is not ‘success’
- Finally, it will return results for the last 24hours
Again, setting this query as an Analytics Rule or a custom query driven Azure Monitor rule will create an alert or incident for us so that we can work to resolve the broken rule.
Wait a Minute!
Hold on there AzureTracks! What about other things that are configured in Sentinel. How do we know when something else breaks?
Try this query in your environment, setting your query Time Range to something really, really long such as 2 years, or the starting date of your setup.
What’s this all about?
We can query against Automation Rules as well! This is great news!
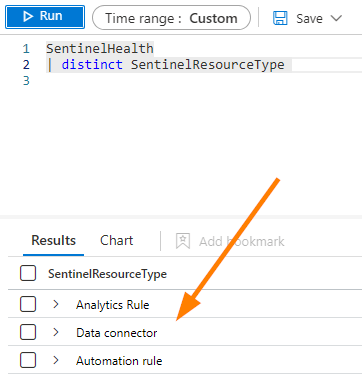
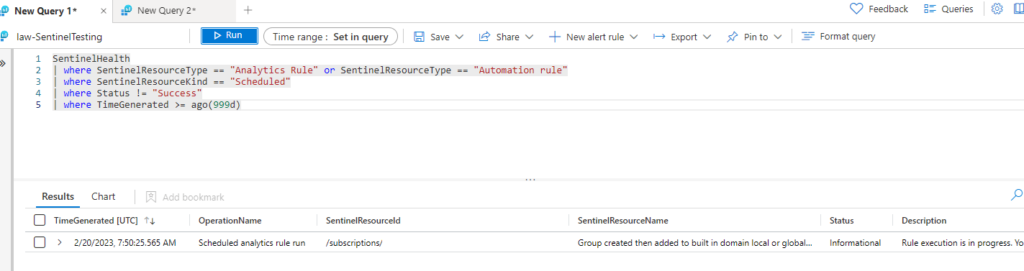
Now, notice the case of these Resource Types my friends! This will matter when we are querying data as if we look for literals, the case sensitivity will impact our results. Let’s see what happens here if we expand our monitoring query to include ALL our resource types we are using:
SentinelHealth
| where SentinelResourceType == "Analytics Rule" or SentinelResourceType == "Automation rule"
| where SentinelResourceKind == "Scheduled"
| where Status != "Success"
| where TimeGenerated >= ago(24h)
Now, you may notice I set my TimeGenerated out quite long here. That’s because I wanted simply to capture something that was not success.
Well this is great! So here it is everyone….create your monitoring or Analytics rule to oversee your Sentinel Implementation in a way that is specific, but also at that 10,000 foot view layer. This will allow for overall monitoring and for your team to get meaningful, helpful alerts about configurations that have something other than success happening!
Final Pro Tip
Monitoring Analytics Rules is likely my own favourite governance task to setup for a client because it creates an over-arching method to monitor ALL other Analytics rules & Automation rules that are not in a success state. It is likely the easiest and most powerful step to monitoring rules that you could take today!
Next Post
In the next post we’ll continue to dive into example queries and how to spend a little bit of time cleaning up and optimizing our Sentinel workspaces to stay efficient and running smoothly.
Source: https://learn.microsoft.com/en-us/azure/sentinel/best-practices & https://learn.microsoft.com/en-us/azure/sentinel/manage-analytics-rule-templates?tabs=update