
Cost Management & Microsoft Sentinel
Let’s talk about Microsoft Sentinel and managing costs. With cost being foundational pillar of Microsoft’s Well Architected Framework, part of good governance, and a major driver for product selection of SIEMs; let’s see if we can take some of mystery out of how to get started with managing costs in our favourite SIEM solution!
Intro
Microsoft Sentinel is a cloud-native Security Information and Event Management (SIEM) system that provides intelligent security analytics and threat intelligence across your enterprise. It is designed to give you insights into your security data and provide threat detection and response capabilities, all at a low cost. In this post, I discuss Microsoft Sentinel cost management and show how you can effectively manage your costs. If you would like to follow along (encouraged!), open up your testing or Dev environment of Sentinel in the Azure Portal at https://portal.azure.com.
Microsoft Sentinel Cost Management
Microsoft Sentinel is designed to provide you with the most cost-effective SIEM solution on the market. Microsoft Sentinel pricing is based on two components: Data Ingestion and Data Analysis. Data Ingestion refers to the amount of data that is ingested into the system. Data Analysis refers to the amount of data that is analyzed by the system.
Data Ingestion Data Ingestion pricing is based on the amount of data ingested into Microsoft Sentinel. This includes data from security logs, network traffic, and other sources. Microsoft Sentinel allows you to choose how much data you want to ingest based on your budget and requirements. You can choose from different tiers of data ingestion, including:
- Pay-As-You-Go: With this tier, you only pay for the data that you ingest. This is ideal for organizations that have variable data ingestion needs.
- Capacity Reservation: With this tier, you can reserve a certain amount of data ingestion capacity for a set period of time. This is ideal for organizations that have consistent data ingestion needs.
- Commitment Tier: With this tier, you can commit to a certain amount of data ingestion capacity for a longer period of time. This is ideal for organizations that have consistent data ingestion needs and want to save on costs.
If we think of Data Ingestion as having really two parts — new data coming in, and data retention, we can now start to think about how long to retain (keep) the data. Data retention should be driven by business and compliance requirements. In my experience, real businesses tend to range from 1 year to 7 years depending on these and other factors. We’ll talk more about how to evaluate these data retention costs in a few minutes here.
Data Analysis
Data Analysis pricing is based on the amount of data that is analyzed by Microsoft Sentinel. This includes data that is ingested into the system as well as data that is generated by the system. Data analysis can happen in a few different ways that should be considered:
- Scheduled queries
- Scheduled Analytics rules
- Real-time Analytics rules (running against every incident created or alert that is analyzed)
- Machine Learning environments (Compute, data, storage)
- Archive tier data utilized for queries
- Automation Rules
- Logic Apps, Playbooks & more…
Microsoft Sentinel Cost Management Dashboard
Microsoft Sentinel provides a cost management dashboard as a Workbook that allows you to monitor your data ingestion and data analysis costs. The dashboard provides an overview of your costs, usage, and savings.
The dashboard provides the following information:
- Cost Summary: This section provides an overview of your costs for data ingestion and data analysis.
- Usage: This section provides an overview of your data ingestion and data analysis usage.
- Savings: This section provides an overview of your savings based on the tier you choose for data ingestion and data analysis.
Here is an example of the Azure Sentinel Cost Management Dashboard:
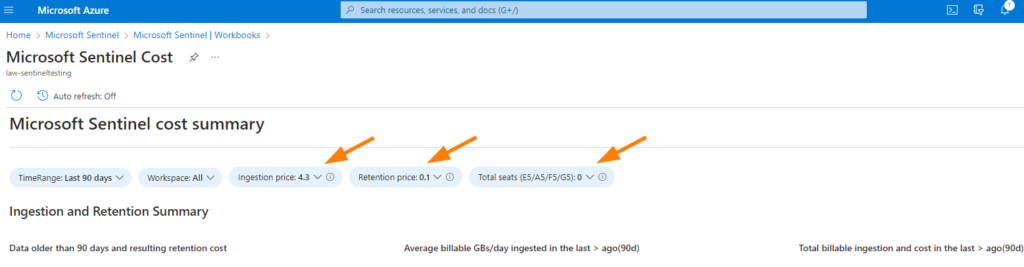
In the workbook, across the pillboxes near the top, select and enter your specific information for pricing tier used, data retention pricing, and number of license seats applicable. These all impact the how the rest of the workbook data is displayed for you. This will give you a good summary level of where major costs are laying within Sentinel.
Additionally, the workbook shows you a good breakdown of tables in your selected Log Analytics Workspaces for the timerange selected at the top of the workbook page. Further, if you are wanting to customize the workbook, you can save it easily and add / remove / or customize the configuration, math, and display using JSON.
Evaluating Data Tables in Log Analytics Workspaces
There are multiple areas to consider in the space of Sentinel cost management with Data Tables in your log analytics workspace. Today we will be determining where our entries and table size are really sitting, and is that table billable.
Here is a sample KQL query to help get you started with your table analysis:
union withsource=TableName1 *
| where TimeGenerated > ago(30d)
| summarize Entries = count(), Size = sum(_BilledSize), last_log = datetime_diff("second",now(), max(TimeGenerated)), estimate = sumif(_BilledSize, _IsBillable==true) by TableName1, _IsBillable
| project ['Table Name'] = TableName1, ['Table Entries'] = Entries, ['Table Size'] = Size,
['Size per Entry'] = 1.0 * Size / Entries, ['IsBillable'] = _IsBillable, ['Last Record Received'] = last_log , ['Estimated Table Price'] = (estimate/(102410241024)) * 0.0
| order by ['Table Size'] desc
Head to your Log Analytics Workspace > Logs > paste the query in once you review it, RUN it when ready.
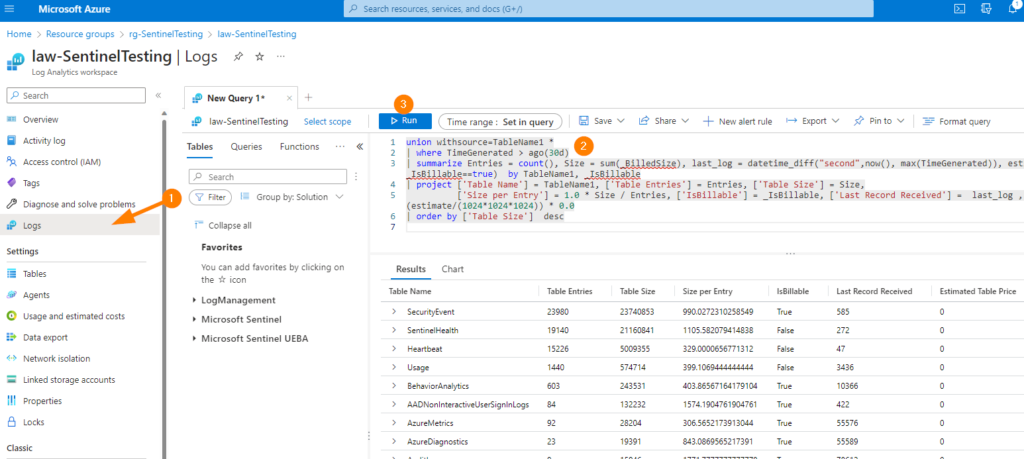
Above, we can see the quick results of this KQL query that let’s us easily see which tables have the most data and entries, and also if that table contains billable data for storage / retention costs.
Want to see what your storage costs are? Update the KQL query to 1.75$/GB as an example cost like this:
union withsource=TableName1 *
| where TimeGenerated > ago(30d)
| summarize Entries = count(), Size = sum(_BilledSize), last_log = datetime_diff("second",now(), max(TimeGenerated)), estimate = sumif(_BilledSize, _IsBillable==true) by TableName1, _IsBillable
| project ['Table Name'] = TableName1, ['Table Entries'] = Entries, ['Table Size'] = Size,
['Size per Entry'] = 1.0 * Size / Entries, ['IsBillable'] = _IsBillable, ['Last Record Received'] = last_log , ['Estimated Table Price'] = (estimate/(102410241024)) * 1.75
| order by ['Table Size'] desc
Conclusion
Microsoft Sentinel is a powerful SIEM system that provides intelligent security analytics and threat intelligence across your enterprise. It is designed to be cost-effective and provides different tiers for data ingestion and data analysis based on your budget and requirements. The cost management dashboard provided by Microsoft Sentinel allows you to monitor your costs and usage and provides an overview of your savings.
We can further explore different settings, timing of automations, and monitor data in our storage accounts to contribute to good stewardship overall. By effectively managing your costs, you can take advantage of Microsoft Sentinel’s capabilities and keep your security budget under control.