
The case of the Duplicate Incidents in Microsoft Sentinel
Microsoft Sentinel is like any service available through Azure, it is constantly changing and evolving, getting better every step of the way. As we do a smaller-scope test of Sentinel’s abilities or simply as capabilities change through evolution; we need to update how some things are done – such as creating incidents. This is the story about the case of the duplicate incidents. We will explore different ways to create Sentinel incidents, and how to determine how an incident was created.
Background:
1. When first deployed and configured, in this case, Microsoft Sentinel was setup to create incidents in a very limited capacity and for specific use cases, not a wide band of threat analytics and other lateral or threat movements.
2. Data retained was limited to only support the approved use cases. No additional data was retained.
To accomplish such as limited usage of Sentinel is an interesting exercise, but accomplished quite simply by utilizing Analytics rules to create incidents after filtering out low-fidelity and data that did not match an approved use case.
Challenge:
As the Sentinel deployment grew and expanded, the power of detection and logic based detection of potential threats was not only powerful in the environment, but triggered an expansion of the use cases to include a lot of best practices to better protect the environments. This meant that configuration of Analytics rules and data connectors would need to be revisited, along with other configurations that were specific to the limited usage such as automation rules and logic apps.
Let’s start to dive in…..
In the portal, we found a number of what appeared to be duplicate incidents, and there had been some efforts to use automation rules to close duplicates before this investigation, so we need to look at the underlying data to get accurate information.
To take a look at alert or incident raw data, I head right into the Log Analytics Workspace. Portal > Log Analytics Workspace > choose your workspace > under General select Logs. Next, we can use a couple of very simple queries to look at the alerts coming into the storage account and not worry about open/closed status just yet.
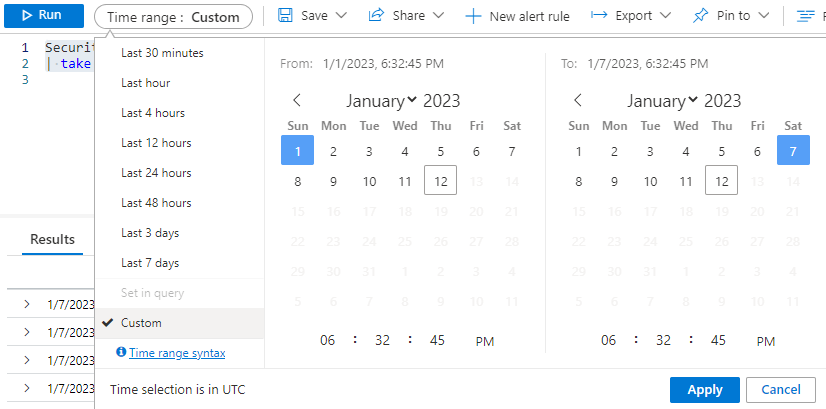
SecurityAlert
   | take 100
Set your date parameters to match a time-period you are looking for. I usually start with the previous week. I limit the results to 10 or 20 rows at first, then expand it to 100 to get a bit larger picture. “Take 100” gives us 100 random rows from within the timeframe we choose.
Choosing a time range looks like this:
The results we piece together from our query may look something like this:
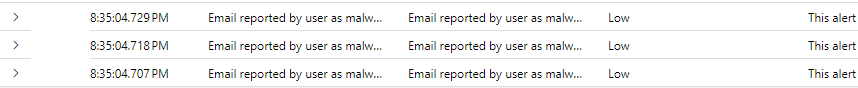
We can see that the alerts above are grouped together quite closely based on the timestamp.
Some other quick queries I use to explore data are:
SecurityAlert
| where Description contains "Description you see in the Sentinel Incident Title"
SecurityIncident
| where Title contains "Description you see in the Sentinel Incident Title"You may also find events in quite a few other tables such as: CommonSecurityLog, OfficeActivity, CloudAppEvents, IdentityLogonEvents & so many more….explore your data and limit your results to move quickly through them.
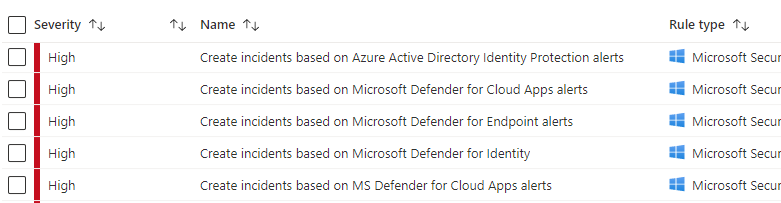
Next, let’s start to understand the set of Analytics rules to consider in our investigation here:
If you select the rule, you can see a summary blade on the right side of your portal that will show you the following information:
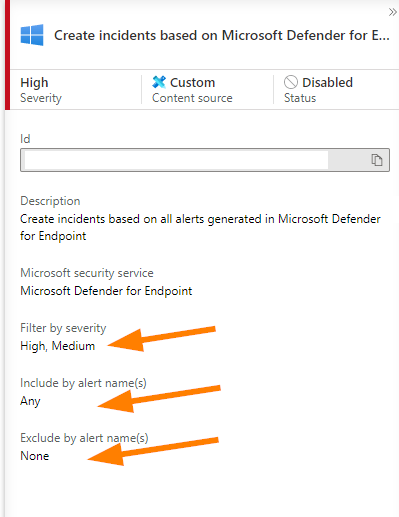
Above is the Defender for Endpoint analytics rule summary blade. We can see that a filter on severity for High and Medium alerts is set and any alert will trigger this with no exclusions.
Below, you can see that the data connector (Portal > Microsoft Sentinel > Configuration section >Data Connectors) for Defender for Endpoint. Note that displayed in summary format is: last data received, number of related Analytics rules templates, and down at the bottom the Data Types enabled in the connector.
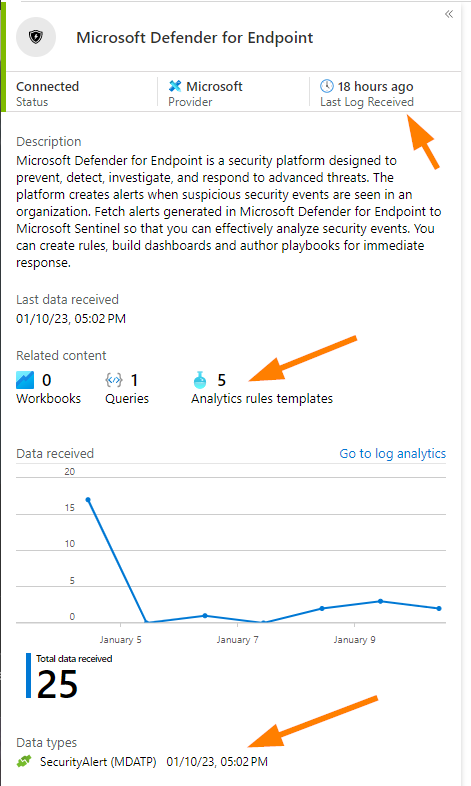
Now we are starting to see how the data connector may be doing something the same with the alert data coming in and possibly triggering twice thus creating a duplicate incident in our portal display. Did you notice that SecurityAlert data type?
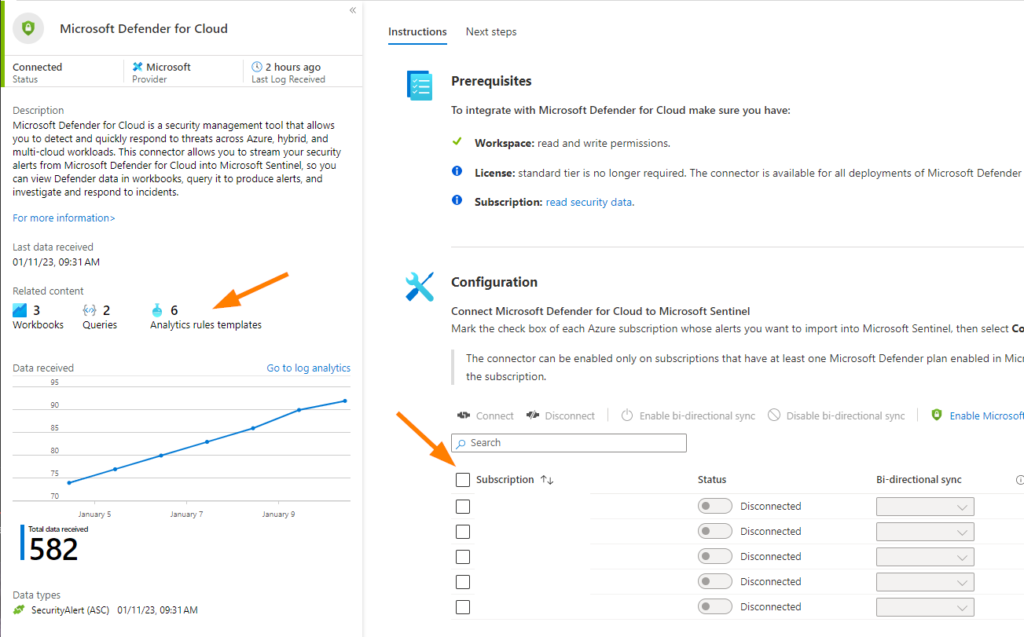
Above, note that if you open the data connector blade you can now see additional configuration details. In our case here, there are some disconnected subscriptions in the Defender for Cloud connector, but we can see the same types of details as the Defender for Endpoint example — related Analytics rules and the data types! Let’s click on those linked Analytics rules templates and take a look at what we have:
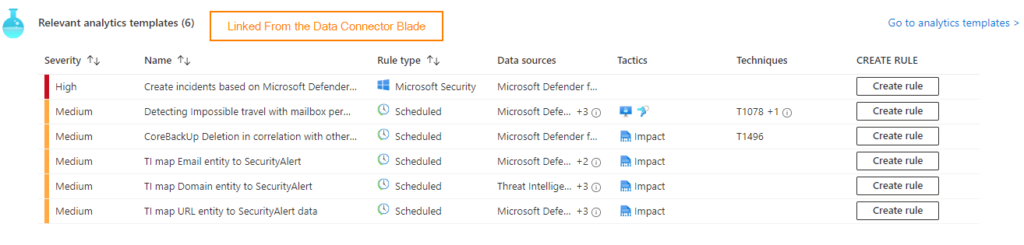
How here we can see the list of the related analytics rules. Notice that under Create Rule you can click the button Create Rule to turn on the rule.
In the case of the duplicate incidents, we had a few analytics rules configured to generate incidents that were overlapped with the data connectors. This led to the duplication. What we saw on this linked Analytics Rule blade was a couple of rules with Enabled. Enabled rules use this button:

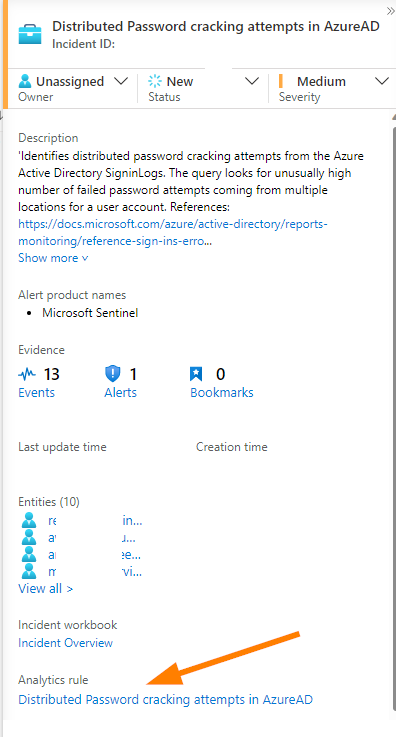
We used our comparison both in the Log Analytics using KQL to look at the raw alerts and incidents, and in the portal by looking at what rule generated the incident in Sentinel:
We determined that it was safe to disable the Analytics rules generating the incidents in this case because we validated that the data connector was creating incidents and that all the data driving the incidents was inside the alerts and incidents data tables. This is important so that we have a full data set while investigating incidents.
We then proceeded to review the Automation Rules in place to ensure that any earlier attempts to quiet the duplicates were also cleaned up and removed. This gave us a clean slate (mostly!) so that we could evaluate if the issue was fully sorted.
Remember, that if you deploy a data connector and choose not to create incidents from that data and instead use Analytics rules to drive incident creation — ensure that you are keeping the data wisely, and that if you change the way incidents are created to clean up your Analytics rules. As always, go to the data and trust the under-lying data to tell us the story.
Thanks for joining me on this journey through Sentinel duplicate incidents and investigating the true cause!