
Deploy a Log Analytics Workspace
A log analytics workspace is an environment that is made especially for storing log data. This can be Azure Monitor, or other diagnostic log data. We’ll cover a few different uses for log analytics data in this article and how to get data into your workspace. Know that each workspace has it’s own data repository, configuration, and data sources. Join me as I take a look at deploying a log analytics workspace today!
Today we’ll start off with a test subscription or dev/text environment that we can use at https://portal.azure.com and then select the search bar at the top or click on create a resource:

Type in log analytics workspace or select that, and let’s get to the landing page:

Ok, now we want to create a new Log Analytics Workspace, click on +Create

Next, fill in the fields with some logical naming.
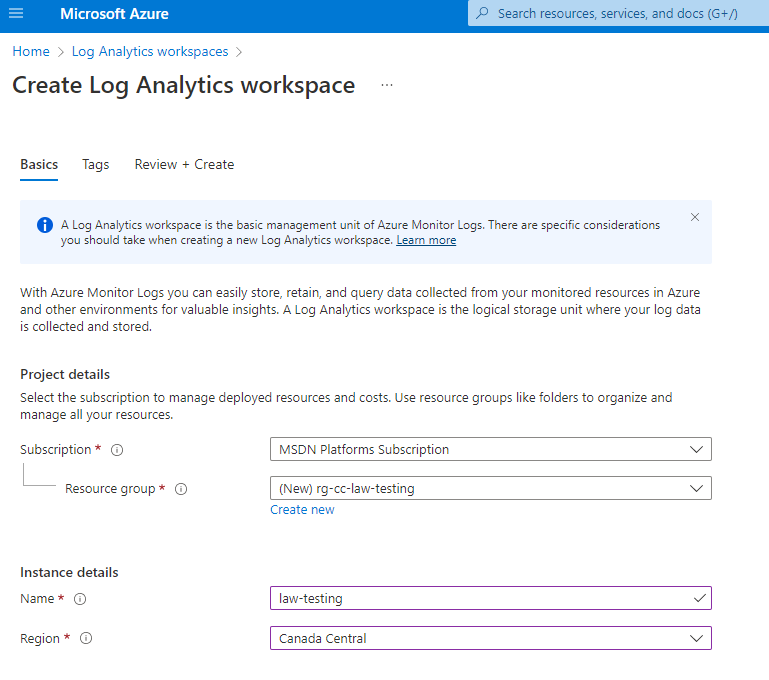
I kept things simple for my naming today since we’ll be in Canada Central (cc) and working with Log Analytics Workspaces (law), doing some testing together.
Ok, once your LAW is deployed, let’s jump over to that resource and look at some of our configuration options first. After this, we’ll go take a look at where to start pushing some log data into the workspace.
So, first things first. Let’s prevent our log analytics workspace from accidental deletion. Jump to Locks > Add > enter a name and notes, select Delete as the lock type and click on OK.
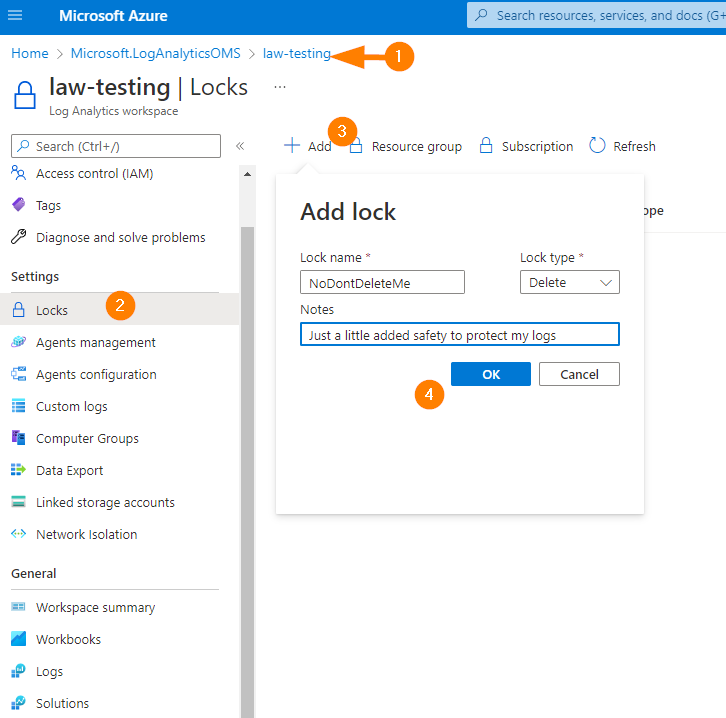
Now you should see something like this:

This will prevent an accidental delete operation from removing our workspace and our data inside it. Good stuff.
Alright, let’s move to something that everyone always asks about….the cost and data retention. Let’s go down to the Usage and Estimated Costs blade:
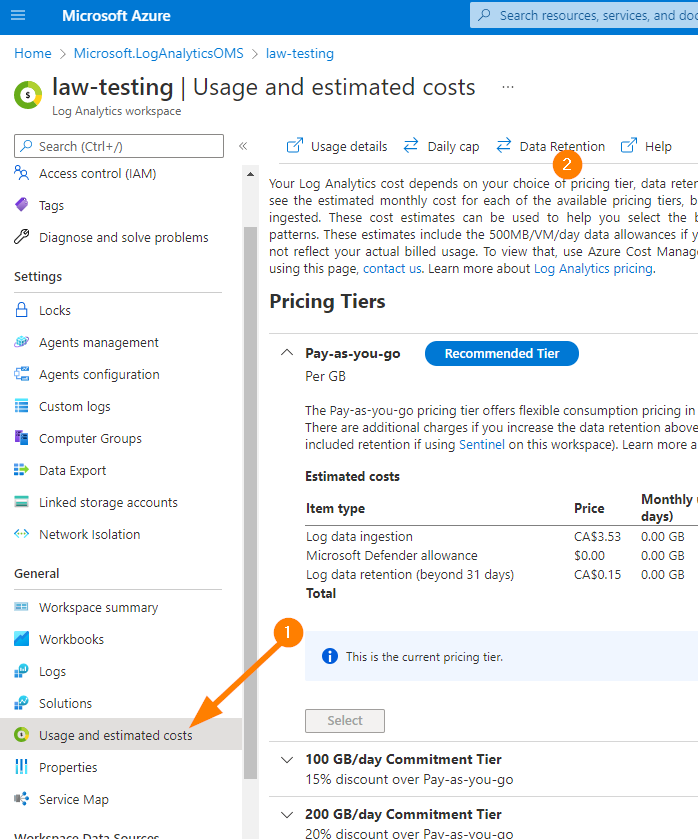
Next, choose Data Retention.
Ok, a couple of interesting things here — depending on your Tier (Pricing Tier), you may have some slightly different options such as limited to 7 days on some free data tiers (IE: Office 365 Activity and other data sources that we can choose data retention for).
Now, I set Pay as You Go data retention in our test workspace to 6 months:
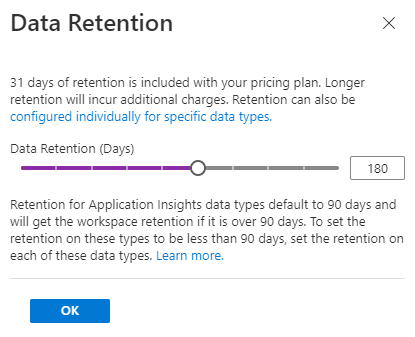
Click on OK
The next thing to set is our daily cap. This one is a bit tricky, but we can use this to help with cost controls. The other view on this is to collect everything (setting our cap quite high – or not setting a cap at all) and use data retention to expire our log data based on age. This is a very good reason to have multiple log analytics workspaces and break apart our logs based on our data retention requirements.
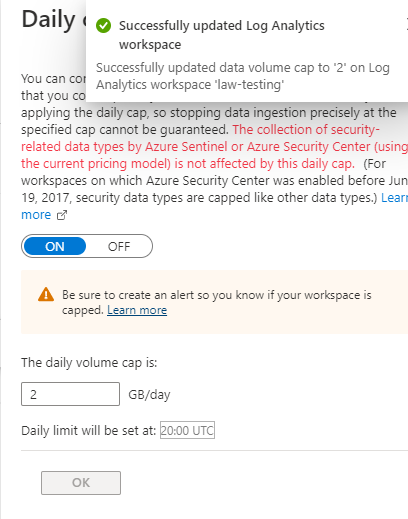
Alright, so we have successfully setup and done a quick retention configuration and data cap so we have some basic controls in place on our log analytics workspace.
Now, let’s take a look at how to get data into it.
Go back to the portal Home, and in the search bar type ‘azure active directory’, then select the same.

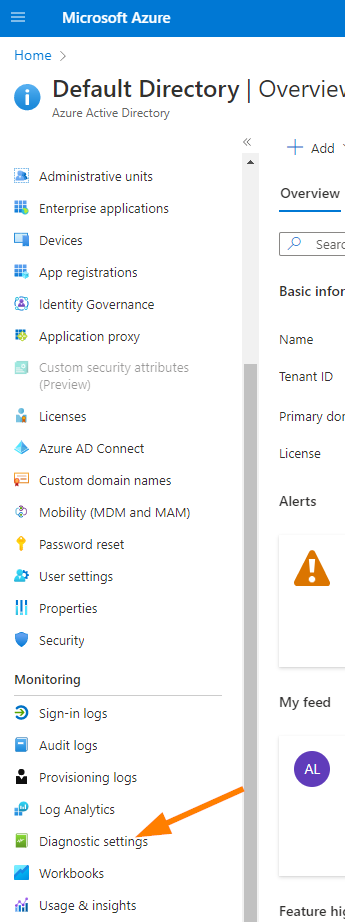
On the Azure Active Directory blade, scroll down to Diagnostic Settings.
Ok, now….you might want to open another Azure browser tab and do some exploring to other types of resources that you would want to collect logs on….such as Azure Firewall, load balancers, application gateways and so on.
We use Diagnostic settings to stream the export of logs and metrics into different destinations. Let’s do a a brief setup here….and we’ll just use our Log Analytics workspace today to keep it all simple. In a production environment, we would use a storage account and Log Analytics to stream data out…I’ll do another article in the future to talk about that though.
Ok, so the first thing you should see across the top of Diagnostic Settings page is the different account types we can use here:

Today, we’ll stick to Log Analytics workspace.
Click on the +Add Diagnostic Setting:
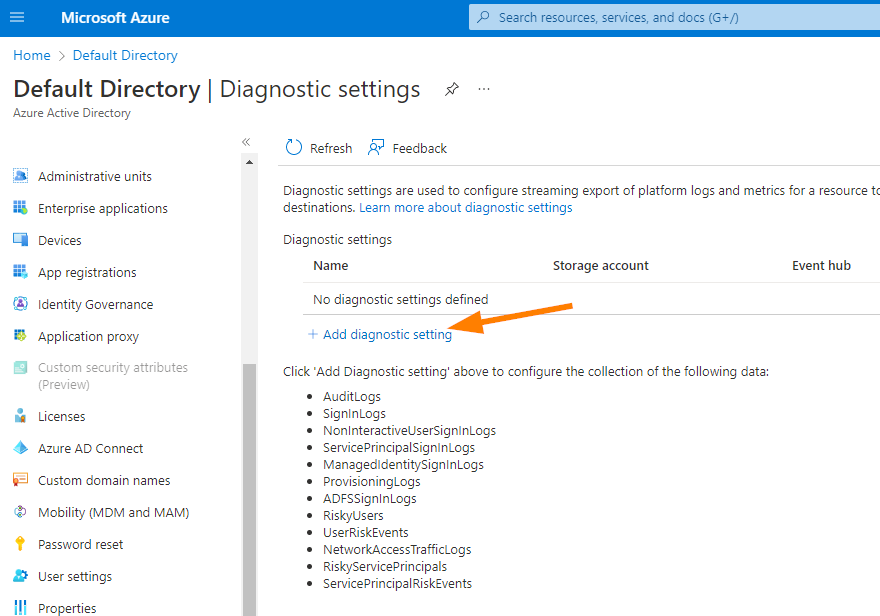
So a couple of things here:
1. We need to select all the required data types to stream into our log analytics workspace.
2. We need to have proper Azure AD P1 or P2 licenses to export Sign-in data anywhere. You can let it ride, or start a trial to configure it a bit deeper and play with the settings if you like….again, we are keeping it simple today.
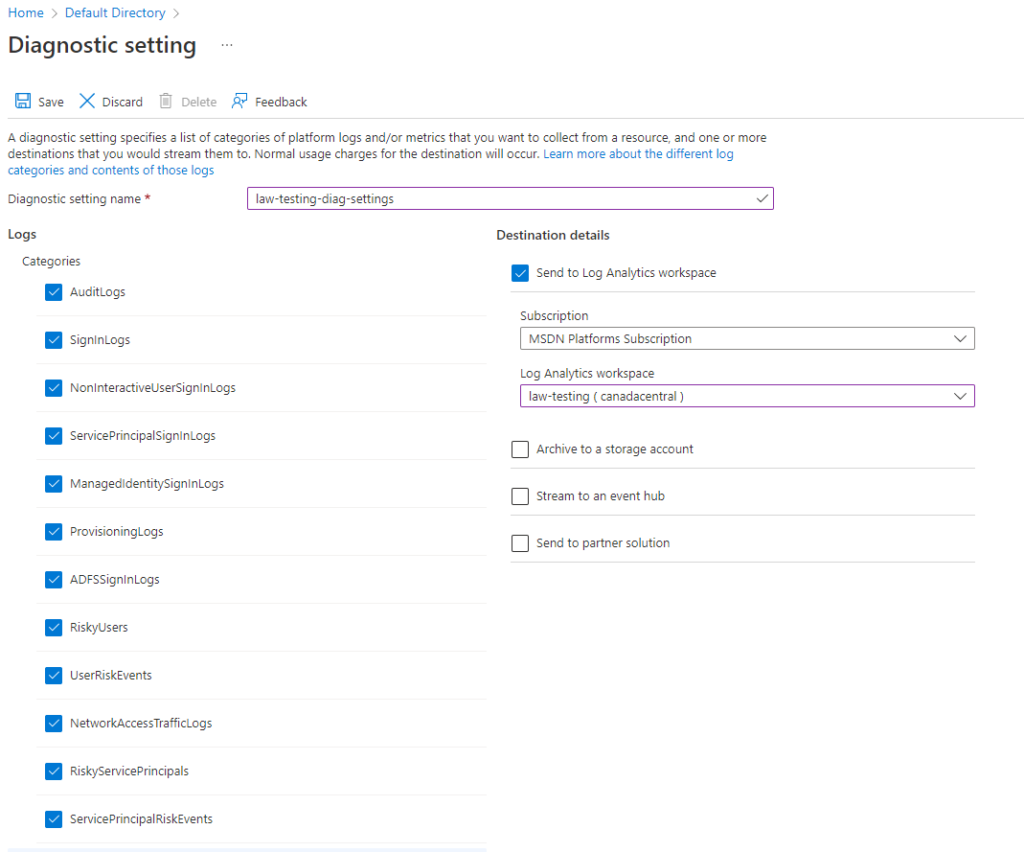
Select ALL the types of Log Categories available, then choose your Log Analytics workspace that we created about 1 cup of coffee ago. Remember to click on SAVE near the top-left once everything is set. You will need to enter a name, I chose: law-testing-diag-settings.
It takes about 15-30 minutes for data to start streaming into your workspace, so go ahead and start generating some login events, I like to do some good & failed logons just to see what actually shows up. Go ahead….I’ll wait here…..
While we wait, notice that in the navigation we can go to Agents Management.
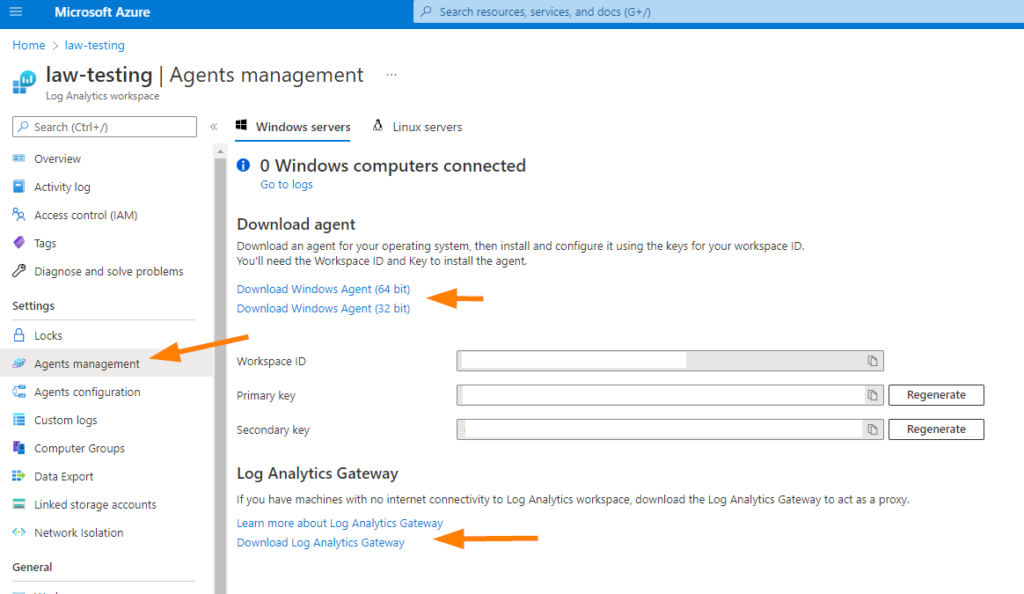
The log analytics gateway is a great tool to use if you have systems that cannot be granted Internet connectivity, but you need to include specific logs from those systems in log analytics to ensure they are saved and retained correctly. This is a great tool to use for near-line/off-line systems and the agent doesn’t care what the source is, it’s just logs. There’s a bit more to it, but I thought you might like to know that. You can learn all about Log Analytics Gateway here.
Ok, let’s go to Overview in our Log Analytics Workspace > Then choose Workspace Summary under the General section.
Choose Logs
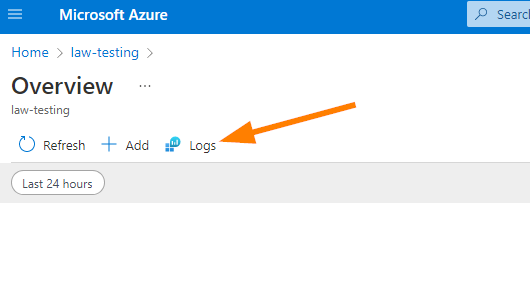
Next a big pop-up will display, click on the X in the top-right to close it out.
So now we’ll jump right into the deep end of finding data in a Log Analytics workspace. Don’t feel too over-whelmed here as this is really about using pre-formatted queries to find information on something interesting.
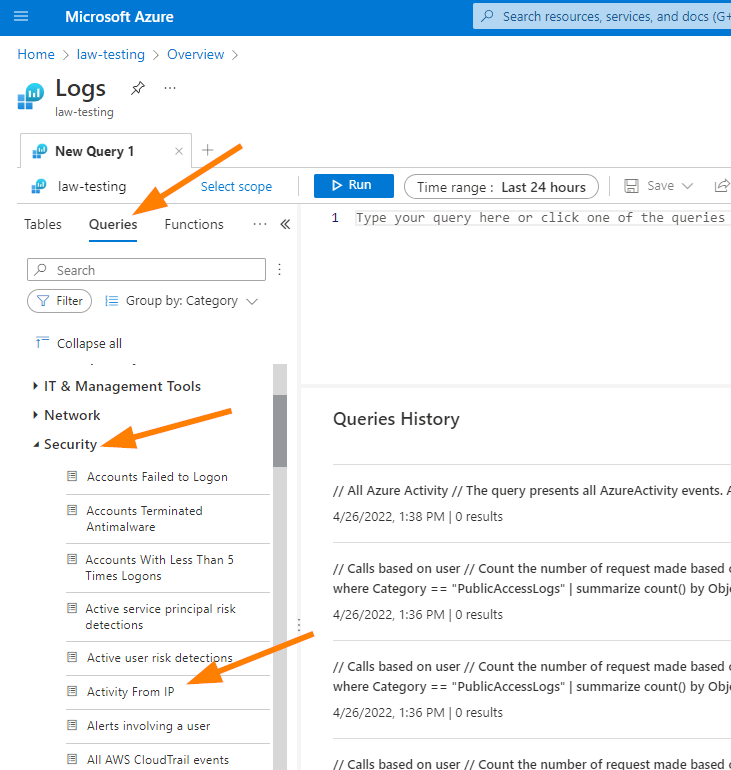
Ok, now let’s imagine we want to see something interesting about Activity happening in Azure Active Directory. We Choose Queries > Then down to Security > and we can choose Activity from IP, or Azure Activity.
Try double-clicking the query you want to see. I chose Azure Activity:
AzureActivity
| project TimeGenerated, Caller, OperationName, ActivityStatus, _ResourceId
The above little KQL query shows in the Query workspace. If you choose the blue RUN box above that workspace, you will see the results of the query in the space below it.
So here is another one but for Azure Firewall Log Data limited to 100 results:
AzureDiagnostics
| where Category == "AzureFirewallNetworkRule" or Category == "AzureFirewallApplicationRule"
//optionally apply filters to only look at a certain type of log data
//| where OperationName == "AzureFirewallNetworkRuleLog"
//| where OperationName == "AzureFirewallNatRuleLog"
//| where OperationName == "AzureFirewallApplicationRuleLog"
//| where OperationName == "AzureFirewallIDSLog"
//| where OperationName == "AzureFirewallThreatIntelLog"
| extend msg_original = msg_s
// normalize data so it's eassier to parse later
| extend msg_s = replace(@'. Action: Deny. Reason: SNI TLS extension was missing.', @' to no_data:no_data. Action: Deny. Rule Collection: default behavior. Rule: SNI TLS extension missing', msg_s)
| extend msg_s = replace(@'No rule matched. Proceeding with default action', @'Rule Collection: default behavior. Rule: no rule matched', msg_s)
// extract web category, then remove it from further parsing
| parse msg_s with * " Web Category: " WebCategory
| extend msg_s = replace(@'(. Web Category:).*','', msg_s)
// extract RuleCollection and Rule information, then remove it from further parsing
| parse msg_s with * ". Rule Collection: " RuleCollection ". Rule: " Rule
| extend msg_s = replace(@'(. Rule Collection:).*','', msg_s)
// extract Rule Collection Group information, then remove it from further parsing
| parse msg_s with * ". Rule Collection Group: " RuleCollectionGroup
| extend msg_s = replace(@'(. Rule Collection Group:).*','', msg_s)
// extract Policy information, then remove it from further parsing
| parse msg_s with * ". Policy: " Policy
| extend msg_s = replace(@'(. Policy:).*','', msg_s)
// extract IDS fields, for now it's always add the end, then remove it from further parsing
| parse msg_s with * ". Signature: " IDSSignatureIDInt ". IDS: " IDSSignatureDescription ". Priority: " IDSPriorityInt ". Classification: " IDSClassification
| extend msg_s = replace(@'(. Signature:).*','', msg_s)
// extra NAT info, then remove it from further parsing
| parse msg_s with * " was DNAT'ed to " NatDestination
| extend msg_s = replace(@"( was DNAT'ed to ).*",". Action: DNAT", msg_s)
// extract Threat Intellingence info, then remove it from further parsing
| parse msg_s with * ". ThreatIntel: " ThreatIntel
| extend msg_s = replace(@'(. ThreatIntel:).','', msg_s) // extract URL, then remove it from further parsing | extend URL = extract(@"(Url: )(.)(. Action)",2,msg_s)
| extend msg_s=replace(@"(Url: .*)(Action)",@"\2",msg_s)
// parse remaining "simple" fields
| parse msg_s with Protocol " request from " SourceIP " to " Target ". Action: " Action
| extend
SourceIP = iif(SourceIP contains ":",strcat_array(split(SourceIP,":",0),""),SourceIP),
SourcePort = iif(SourceIP contains ":",strcat_array(split(SourceIP,":",1),""),""),
Target = iif(Target contains ":",strcat_array(split(Target,":",0),""),Target),
TargetPort = iif(SourceIP contains ":",strcat_array(split(Target,":",1),""),""),
Action = iif(Action contains ".",strcat_array(split(Action,".",0),""),Action),
Policy = case(RuleCollection contains ":", split(RuleCollection, ":")[0] ,Policy),
RuleCollectionGroup = case(RuleCollection contains ":", split(RuleCollection, ":")[1], RuleCollectionGroup),
RuleCollection = case(RuleCollection contains ":", split(RuleCollection, ":")[2], RuleCollection),
IDSSignatureID = tostring(IDSSignatureIDInt),
IDSPriority = tostring(IDSPriorityInt)
| project msg_original,TimeGenerated,Protocol,SourceIP,SourcePort,Target,TargetPort,URL,Action, NatDestination, OperationName,ThreatIntel,IDSSignatureID,IDSSignatureDescription,IDSPriority,IDSClassification,Policy,RuleCollectionGroup,RuleCollection,Rule,WebCategory
| order by TimeGenerated
| limit 100
Alright. You created a log analytics workspace, a diagnostic setting to stream data into your workspace, and you added some data retention rules on your workspace today. Plus you also took a look at how to query those logs in your workspace and get meaningful data out of it.
Remember to remove your diagnostic setting and remove the workspace storage account once you are done your testing!
Until next time, thanks for joining me for this little journey today!