
Using Azure Dashboard with Sentinel
In this post we explore using Azure Dashboard to help summarize Sentinel reporting and to provide an enhanced method for non-technical users to understand the current incidents in Microsoft Sentinel. We will look at creating Azure Dashboards, KQL queries, displaying data in a meaningful way, and how to grant users permission to see the dashboard.
Let’s dive right in! First up, let’s get logged into our testing environment at https://portal.azure.com.
Now, let’s use the search box at the top of Azure’s home blade and search for “Dashboard”. Select Dashboard Hub and let’s jump into Dashboards!
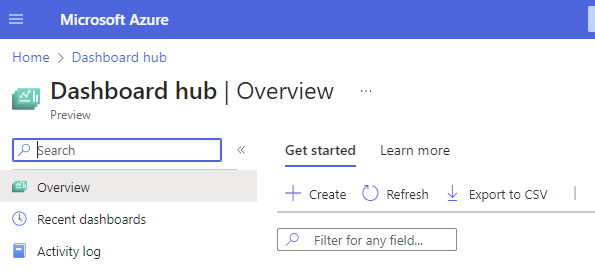
Next, select CREATE.
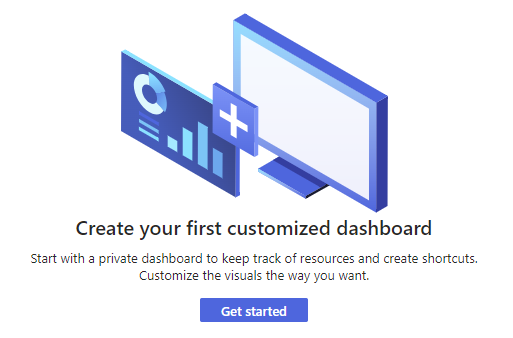
If you have no dashboards created, go ahead and click on GET STARTED.
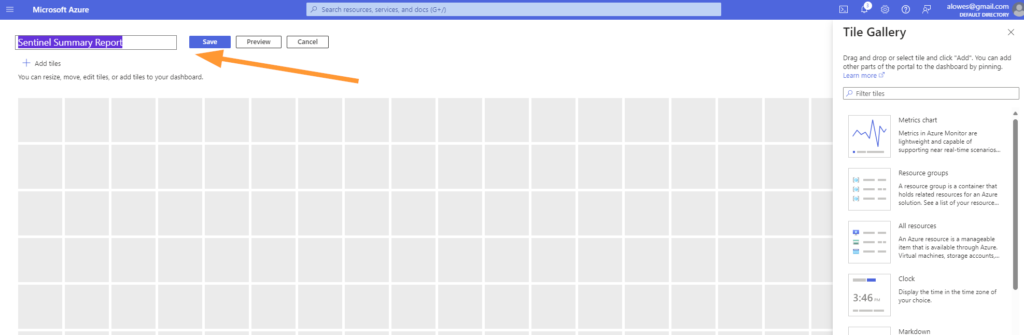
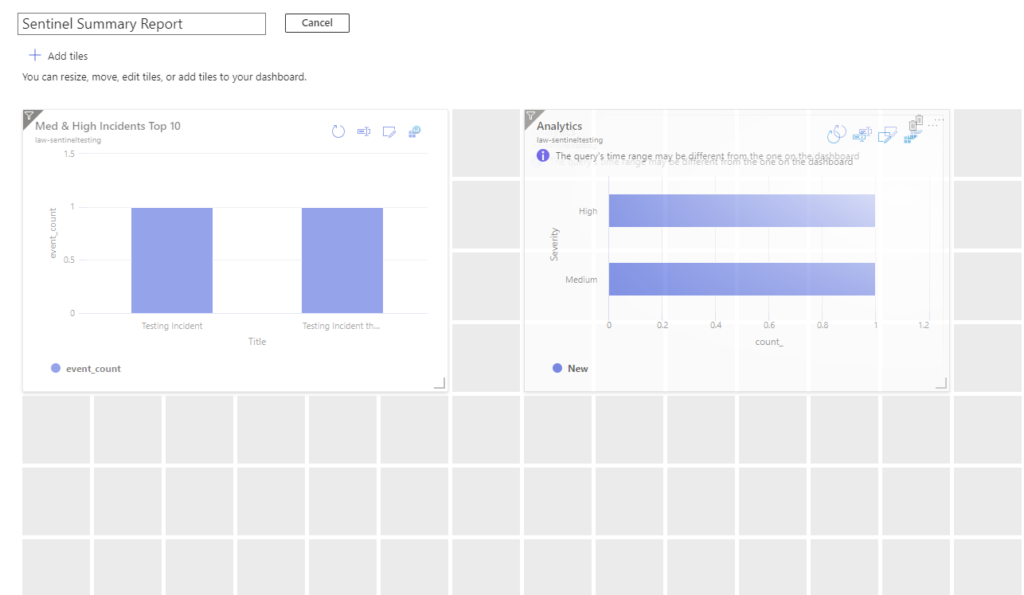
The dashboard will be created quite quickly. Go ahead and enter a descriptive name like ‘Sentinel Summary Report’ and click Save.
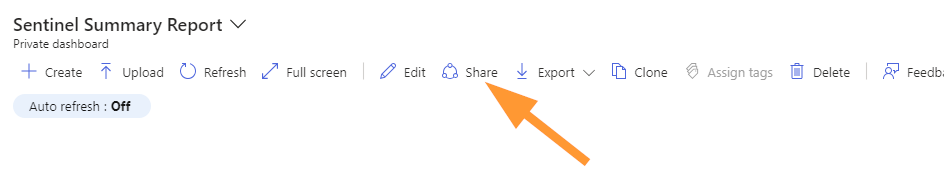
Next, select SHARE:
A new blade displays:
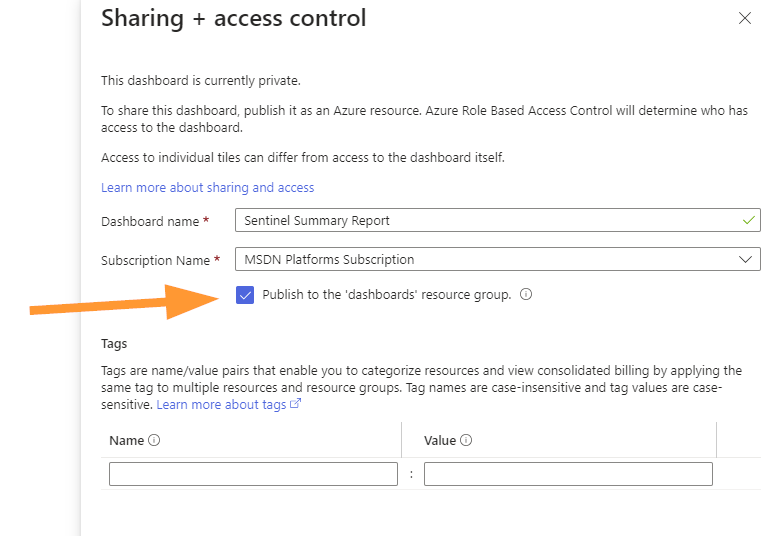
Ensure that PUBLISH TO THE DASHBOARDS RESOURCE GROUP is selected. This will make permissions management easier later.
Alright, now comes the cool part with KQL, Log Analytics, and Azure Dashboards!
Bringing it Together
Next up, open a new tab in your browser and open your Sentinel enabled Log Analytics Workspace. We’ll look at a few queries and call out a couple things along the way here.
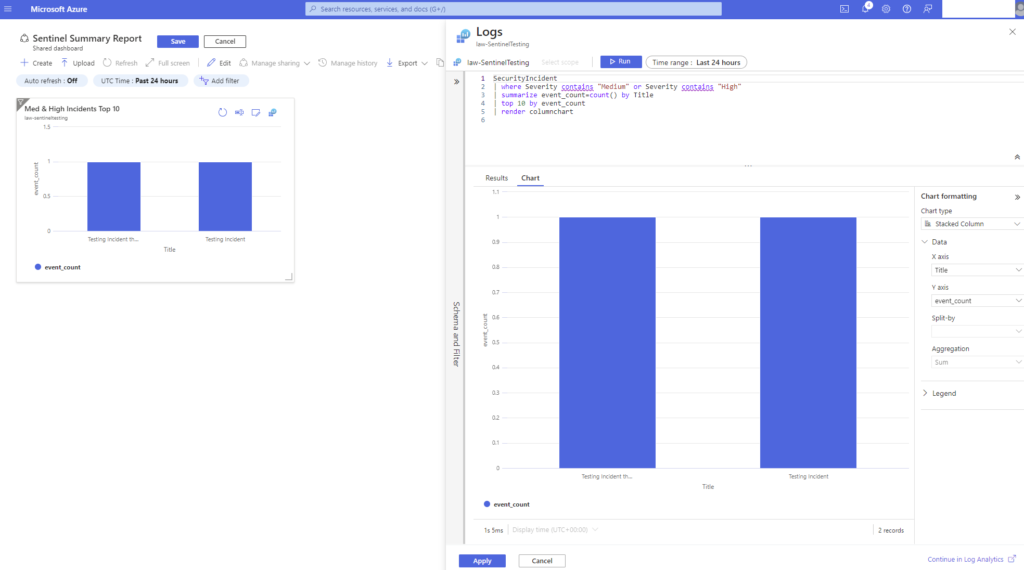
First up, run this query to get incidents that are High and Medium severity, summarized by title, take the top 10, and make it a chart.
SecurityIncident
| where Severity contains "Medium" or Severity contains "High"
| summarize event_count=count() by Title
| top 10 by event_count
| render columnchart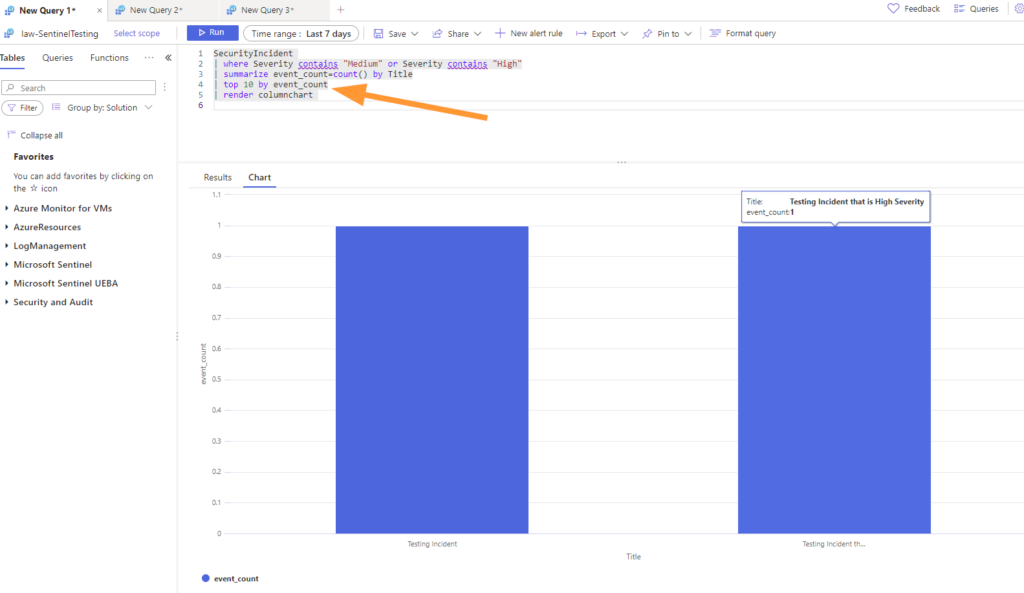
Run the query and you should something like this, but with whatever your incidents are. Now, let’s say we want to include this Incident summary of the top 10 incident types by title in our dashboard, we can easily push this into that new dashboard!
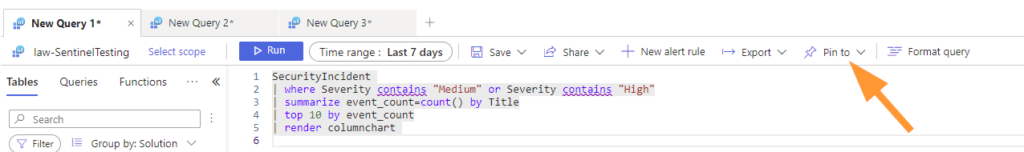
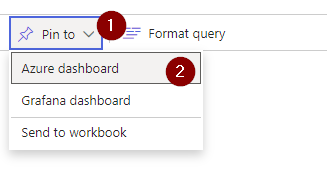
Choose PIN TO.
Next, select your existing dashboard that we just created.
Choose Existing > Shared > Select your Dashboard.
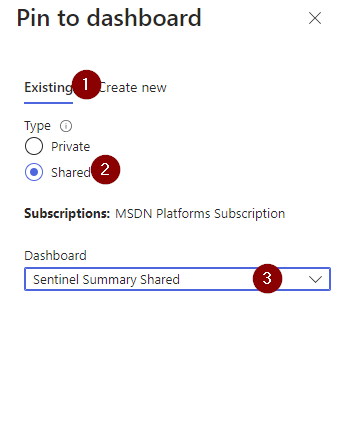
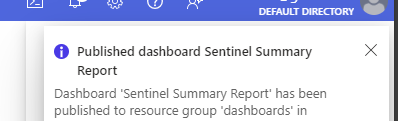
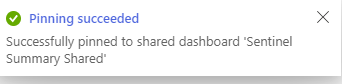
Click on PUBLISH and await your success!
Check on Dashboard Progress
First up, jump back to your dashboard browser tab then click on Refresh.
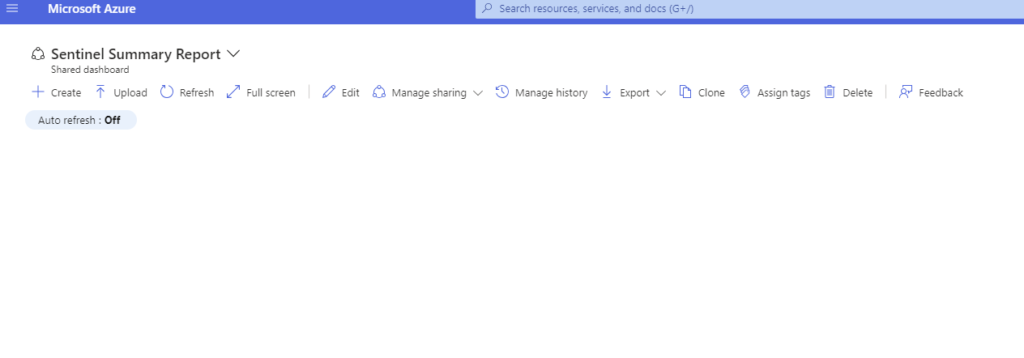
Then…..
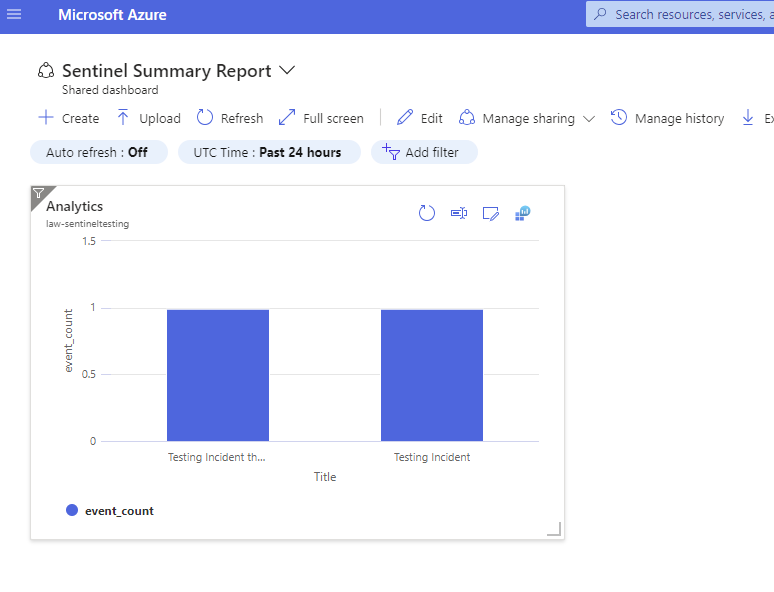
Notice how it looks about the same but we get some dashboard type options for display cleanliness?
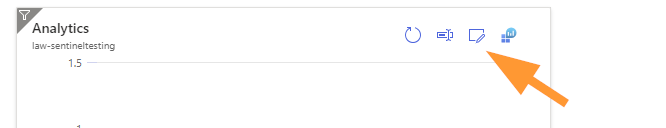
You can edit the title, and even use the screen & pencil icon to edit the query if you need to update that in the future.
Remember any change you make in a dashboard will need to be saved (up at the top), so click on SAVE once you are done editing.
A Few KQL Queries To Get Started
I like to use a few standard queries that summarize the current state, and I always like to follow a couple rules when it comes to dashboards:
- Auto-Refresh is helpful if the dashboard will be displayed on a large monitor and not interacted with. Use this thoughfully.
- Time – Past 24 hours is the default. There may be dashboards you create that 1 week or the Past Week is more helpful, set this and save it as part of the dashboard so that everyone uses the same settings.
- Dashboards are a visual tool to use at-a-glance. Don’t get caught in the details with lines and entries of data….use pictures.
Show the top 10 Security Alerts that are High or Medium severity:
SecurityAlert
| where AlertSeverity contains "Medium" or AlertSeverity contains "High"
| summarize event_count=count() by AlertName
| top 10 by event_count
| render columnchart
Show the top 10 Security Incidents by Severity and Status for the last 14 days:
SecurityIncident
| where TimeGenerated >= ago(14d)
| sort by Status
| summarize count() by Severity, Status
| render barchart
Ok, so I know I said to follow the default time in the dashboard which is typically 24 hours. For the above query it is more to provide a 2 week snapshot of trending. Visualizing makes it better!
Show Open Incidents from the past 14 days:
SecurityIncident
| where not (Status == 'Closed')
| where TimeGenerated >= ago(14d)
| sort by Status
| summarize count() by Status
Let’s Check on our Dashboard
Jump back to your dashboard tab once you’re done testing and pinning queries and results into your dashboard.
Notice how when the results are pinned automatically it’s just a really boring vertical row? Yeah, let’s fix that!
Click on EDIT.
Drag a couple of the results boxes around and see what you come up with.
A couple other queries I really like to see added for summary reports with Sentinel are:
Show the number of incidents closed by automation:
SecurityIncident
| where Status == 'Closed'
| where (ClassificationComment contains "Closed by automation") //not case sensitive.
| summarize count() by Status
Now….this query requires you to use the statement in comments “Closed by automation” in your automation rules and playbooks. Anyone who has worked with me knows that I’m a real stickler for labeling these automations using a comment like this. That little comment allows both human and our queries to differentiate incidents and alerts resolved by automations or humans.
The Inverse — Show the number of incidents not closed by automation:
SecurityIncident
| where Status == 'Closed'
| where not (ClassificationComment contains "Closed by automation") //not case sensitive.
| summarize count() by Status
In this query, the small “not” makes all the difference for us. This query returns incidents that were closed by humans (or mislabeled) so that we can understand the load on our SOC team better.
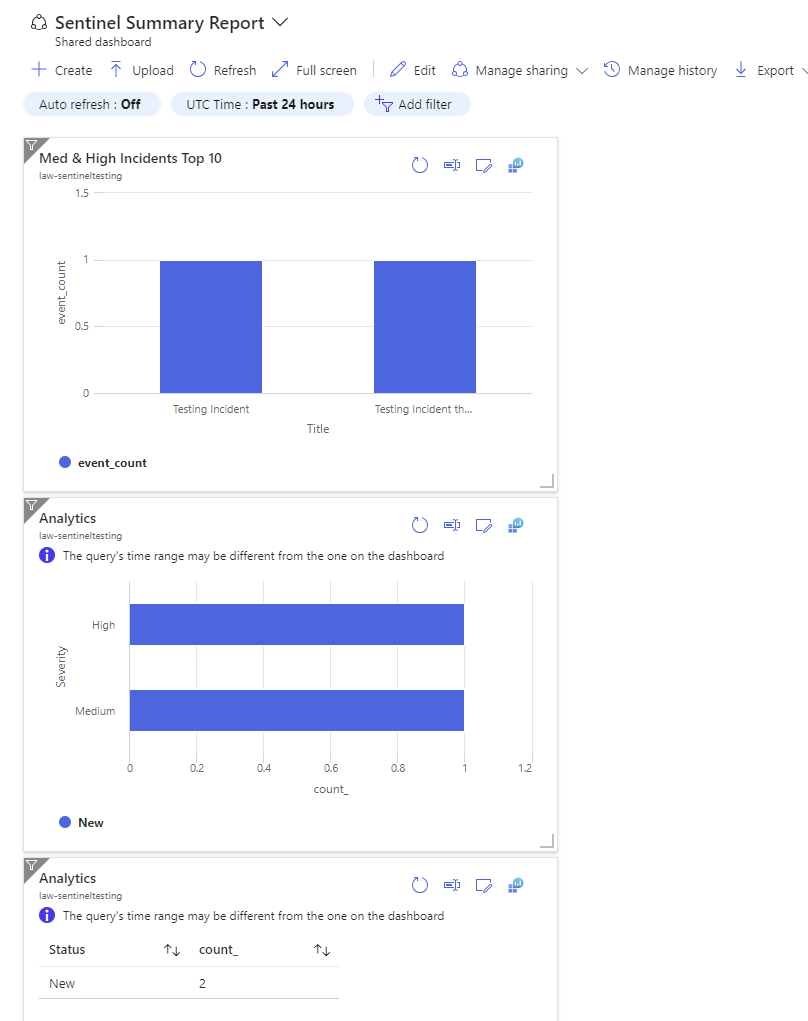
The Final Look
Jump back into your dashboard and refresh so we can see your latest work.
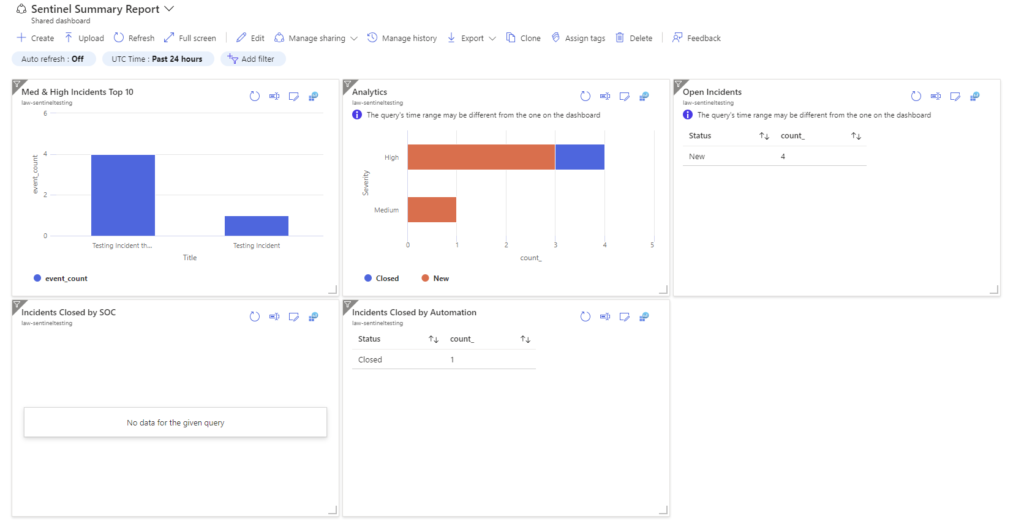
I added a few of the queries we shared here in the post and rearranged them, then I edited a few titles to add better descriptions.
This is the beginnings of a useful dashboard that we can use to show non-technical staff and managers what the SOC is doing today. Great stuff!
How Do People Access This?
Let’s talk about Shared Dashboards.
Head to Resource Groups in your Azure portal. Look for ‘dashboards’. This is the default resource group that Azure will use. As of the writing of this post, some of the Dashboard Hub features are in preview, so I’m going to keep this one simple!
Like any resource group in Azure, we want to use it as a boundary for permissions when possible as it keeps it clean and easy to maintain.
You may have many dashboards over time that not everyone needs access to, there are ways to approach this, and we can of course move a dashboard to another resource group using the ‘MOVE’ functionality within Azure.
Alright, how to grant access?
- There are 2 spots we need to grant access for users
- The dashboard, and
- The data.
First, let’s grant access to the ‘dashboards’ resource group. I’ll suggest using an existing security group whenever possible, or use one we have control over to manage these permissions.
Let’s call our security group ‘Dashboard Users’.
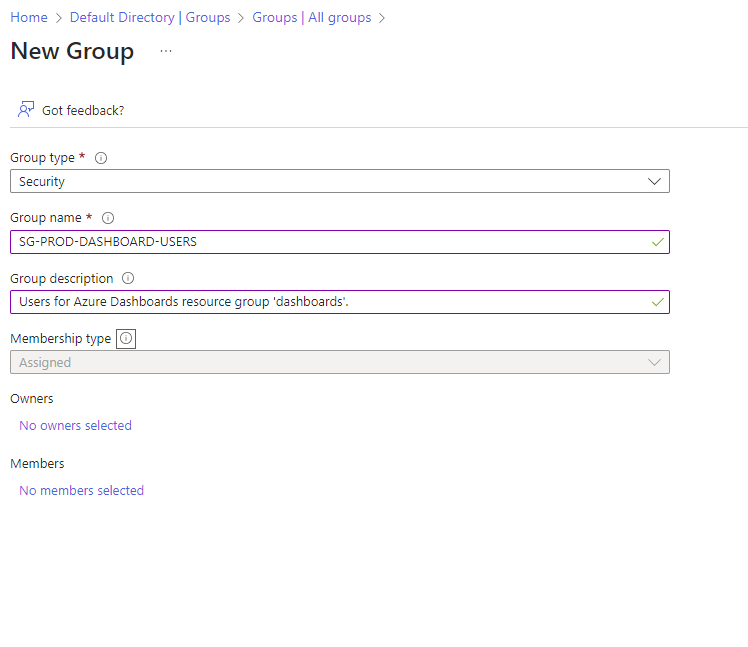
Add your members, etc and Create the group.
Next, back in the ‘dashboards’ resource group:
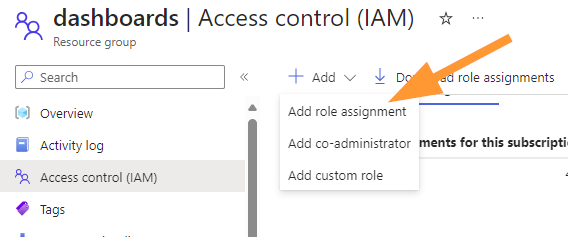
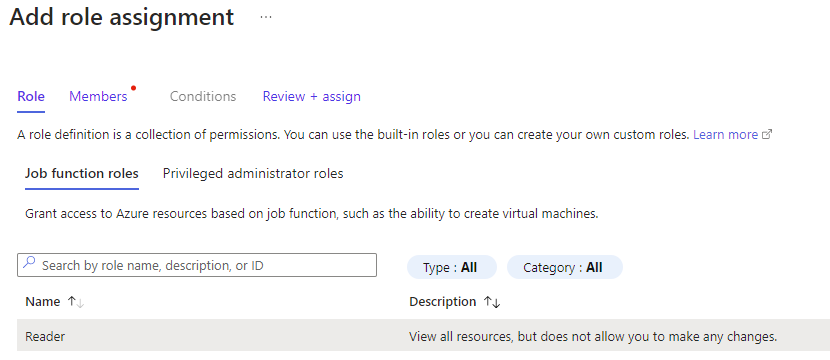
Go to IAM > Add > Add Role Assignment. Choose Reader role.
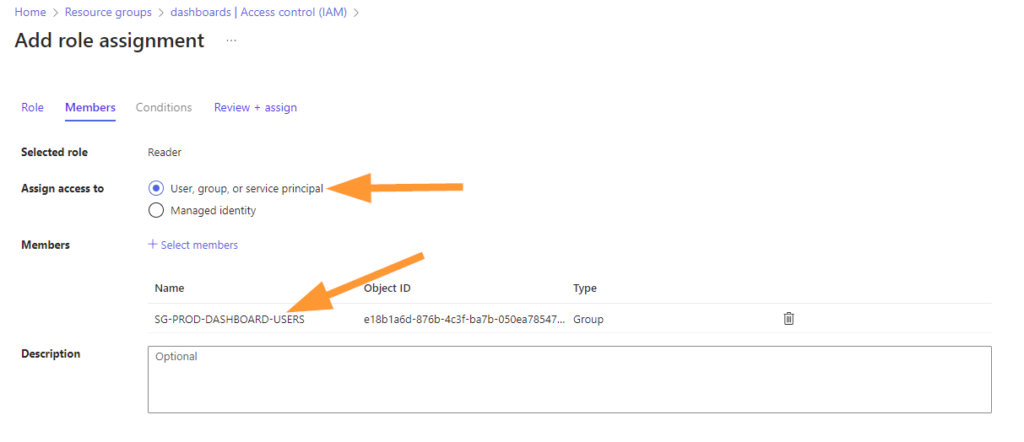
Add your security group to the role:
You may need to refresh or sometimes even make a cup of coffee first, but you should see this shortly:

For your Log Analytics Workspace, repeat this process.
You must add the same security group as Reader access to the Log Analytics Workspace you used to run those KQL queries out of. This will allow the users access to read that same data and run the queries from the dashboard.
Notify your users and provide them a link to your shared dashboard. All done!
Summary
In this post we created a shared dashboard, had some fun with some basic reporting queries in KQL and Log Analytics, looked at Sentinel incident summaries, and made a helpful dashboard for helping non-technical users to see what Sentinel and our SOC team is doing today.
I hope that this will improve the communication within your organization, and maybe help provide some insight into what your Sentinel instance is doing with all those alerts and incidents.
There are certainly a lot more queries to consider for something like this, so please enjoy exploring all the wonderful things you can add!
Thanks for joining me on this journey through Azure Dashboards and Microsoft Sentinel today!
Until next time, stay in the clouds!