Azure Monitor – Service Health Overview
Azure Monitor – Service Health blade can help you get a quick overview of your infrastructure’s health in the Azure datacenters. The old saying of ‘a picture is worth a thousand words’ definitely applies. Many enterprise customers will have their infrastructure distributed across the globe and when encountering issues with their systems, it is far easier to simply look at exceptions visually.
Alerting will almost certainly drive actions through both automation tools and human interaction/response. In the case of getting a quick overview, log into your Azure subscription and go to Azure Monitor, then Service Overview and just take a quick look at what you have going on.

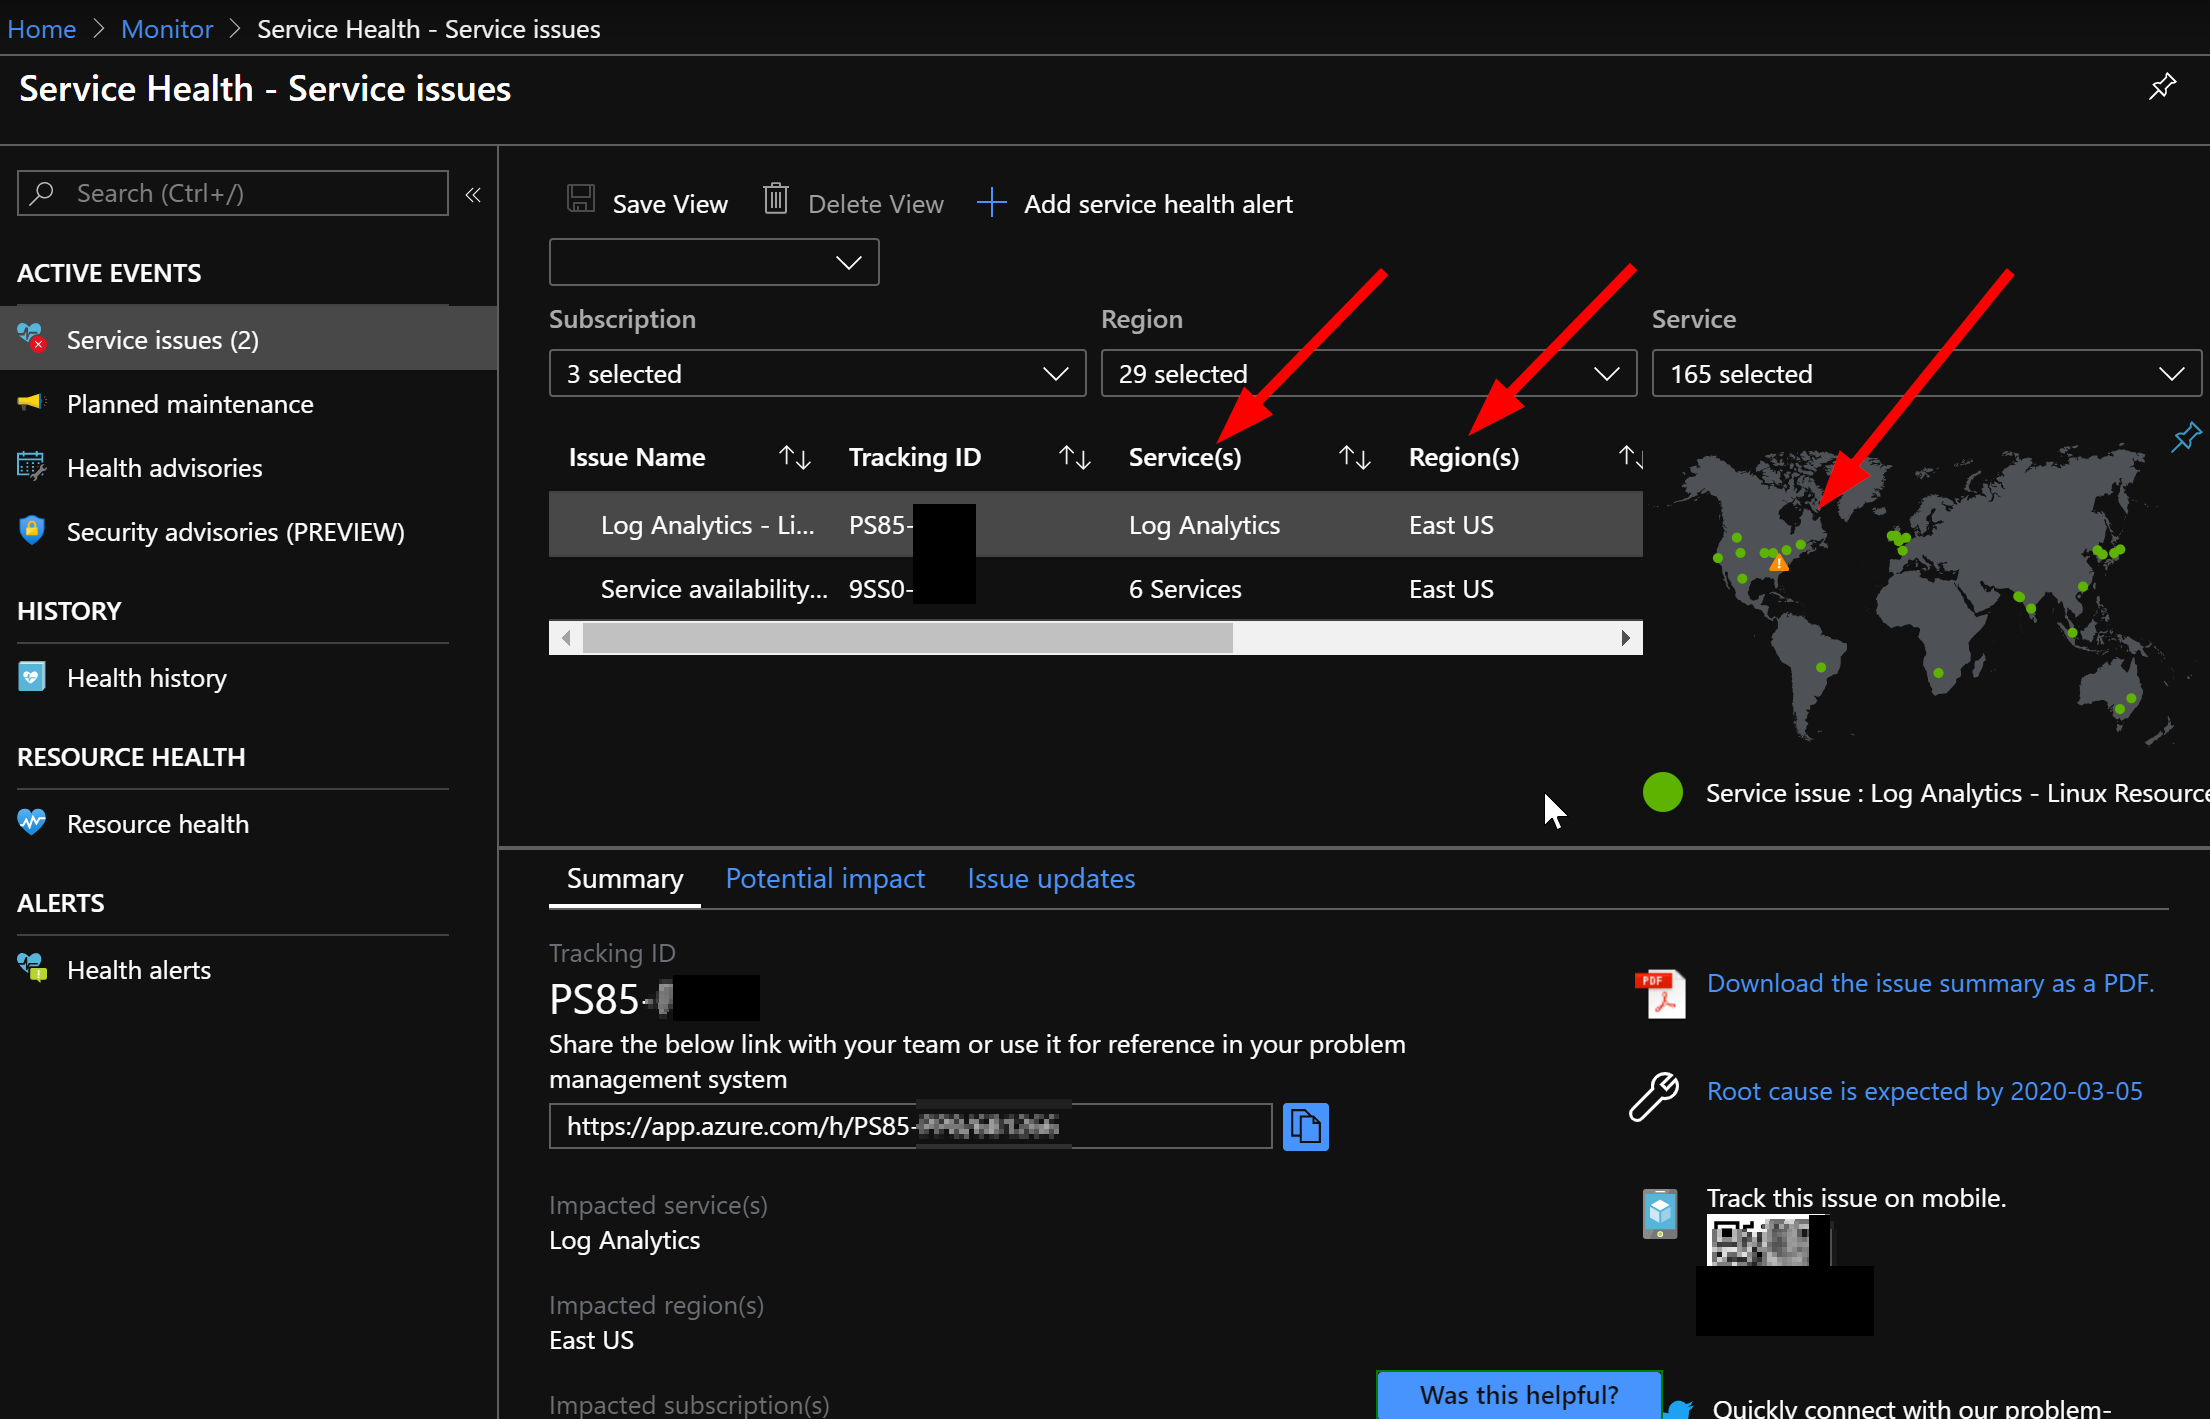
As you can see from my example here, we have 3 subscriptions with 29 regions and 165 Azure services that are being graphed. There are 2 issues with impacts to our infrastructure.
My eye naturally goes to the yellow alert we can see on East US datacenter. Anyone who’s worked with me on monitoring and reporting systems will know that I absolutely love the stop-light system with green, yellow, and red defining the visual status of resources and services.
I just wanted to provide a quick intro to how to quickly, visually see your infrastructure at a very high global level. It’s important to know that when you’re facing challenges in your Azure environments that you can follow a good path to discover where your issues are and if it is underlying infrastructure within Azure, or your configuration that is the real challenge. In a world where businesses expect technical people to have answers in an instant; and know how to resolve challenges, it’s important to be able to move quickly and retain business confidence.