Microsoft Sentinel Baseline Deployment: From Zero to Operational SOC
Microsoft Sentinel Baseline Deployment
A Practical, Microsoft-Aligned Walkthrough Series
Part 1 – Sentinel Foundations: Designing the Baseline You Won’t Regret
Microsoft Sentinel can be enabled in minutes. A good Sentinel deployment takes planning.
I will post a 3 part mini-series on Microsoft Sentinel Baseline from Day 0 to Operations. This is intended to help clear the fog of all the different SIEM solutions and opinions; and is meant for you to follow along and deploy together with me! We have a lot of fun on AzureTracks while we solve challenges, but this series is a bit more tempered to the current digital security landscape so that we can all understand the foundational pieces to allow Sentinel to scale without the pain.
Most Sentinel pain does not come from missing detections or weak analytics. It comes from architectural shortcuts taken on day one: poorly scoped workspaces, uncontrolled access, unpredictable ingestion costs, and a lack of governance before the first alert ever fires.
In this series first post, we walk through a clean baseline Sentinel foundation, following Microsoft Learn guidance and real-world operational best practices. We’ll design the workspace correctly, secure it properly, and configure it so future growth is intentional—not accidental.
This is the part that is hard to fix later. So we do it properly now.
Deploy into a test environment first. Before enabling analytics rules, Automation Rules, or Logic Apps in production, always deploy them to a sandbox or test workspace. This allows your SOC team to validate alert generation, automation behavior, and incident workflows without risking production systems. Testing first prevents accidental remediation, alert storms, or misconfigurations from impacting real users and resources.
In this foundations post (a series to take your Sentinel deployment across the void to Operational!), we begin with the basics. Let’s jump right in!
Step 1 – Validate Prerequisites Before You Click “Enable”
Before touching Sentinel, confirm the following:
- An Azure subscription with Owner or Contributor
- Microsoft Entra ID fully operational
- Log Analytics workspace created in a supported Sentinel region
- Appropriate licenses for Defender and M365 data sources you plan to ingest
Sentinel does not “bring its own storage.”
It is Azure Monitor, with opinions.
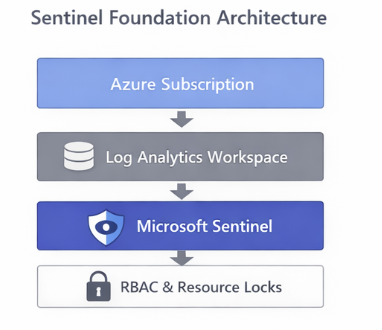
Step 2 – Create (or Select) the Right Log Analytics Workspace
Microsoft-Recommended Baseline
For most organizations:
- One primary workspace
- One SOC
- One security boundary
Avoid:
- One workspace per team
- One workspace per data source
- One workspace per curiosity
These models fragment detections, complicate RBAC, and make threat hunting unnecessarily painful.
Walkthrough
- In Azure Portal → Log Analytics workspaces
- Create a new workspace
- Choose a region aligned with:
- Data residency requirements
- Defender data location
- Name it clearly (this matters later):
law-sentinel-prod
Step 3 – Configure Retention and Cost Controls (Immediately)
Set Retention Explicitly
- Log Analytics workspace → Usage and estimated costs
- Click Data retention
- Set:
- Analytics retention: 30–90 days (baseline)
- Archive retention: Based on compliance needs
Default settings are rarely the right settings.
Configure Daily Cap
- Usage and estimated costs → Daily cap
- Set a reasonable limit
- Configure alerting when nearing cap
This does not replace good ingestion hygiene—but it does prevent surprises.
Step 4 – Enable Microsoft Sentinel
Now—and only now—enable Sentinel.
- Azure Portal → Microsoft Sentinel
- Click Create
- Select your prepared workspace
You now have Sentinel. But it is not ready for people yet.
Step 5 – Lock It Down (RBAC and Protection)
Recommended Roles
| Role | Who Gets It |
| Sentinel Reader | Tier 1 analysts |
| Sentinel Responder | Tier 2/3 analysts |
| Sentinel Contributor | Detection engineers |
| Owner | Platform team only |
Never broadly assign:
- Log Analytics Contributor
- Workspace Owner
Those bypass Sentinel’s guardrails entirely. If you are a smaller Security Team then you may want to get better acquainted with PIM and Sentinel Roles. Remember that Sentinel Roles are assigned on the resource group. Other roles can be assigned in various ways.
Add Resource Protection
- Apply resource locks to the workspace
- Use Azure Policy to prevent deletion
- Enable activity logging on Sentinel resources
A SIEM that can be deleted accidentally is not a SIEM.
Step 6 – Enable Diagnostic Logging for Sentinel
Why it Matters
Even a perfectly configured Sentinel workspace can be silently modified. Diagnostic logging ensures every operation is captured for auditing, troubleshooting, and compliance reporting. This includes:
- Analytics rule creation or updates
- Automation rule executions
- Workspace settings changes
- Resource access attempts
Walkthrough
- Azure Portal → Microsoft Sentinel → Select your workspace
- Click Diagnostic settings → + Add diagnostic setting
- Choose a target (one of the following recommended options):
- Dedicated Log Analytics workspace (preferred for central auditing)
- Storage account (for long-term retention, regulatory compliance)
- Event Hub (if integrating with third-party SIEM or monitoring tools)
- Select categories to capture:
- AuditLogs
- AlertRules
- AutomationRules
- SecurityAlert
- Other relevant Sentinel tables
- Set retention policy (if using storage) to match your compliance needs
- Click Save
Validation Query
SentinelAuditLogs
| where TimeGenerated > ago(7d)
| summarize Changes = count() by OperationName, Actor
| order by Changes desc
This confirms that Sentinel operations are now being audited and that any future changes will generate a traceable record.
Baseline Validation Query
Run this to confirm Sentinel health:
SentinelHealth
| summarize LastHeartbeat = max(TimeGenerated) by Computer
| order by LastHeartbeat desc
If Sentinel can’t observe itself, stop here and fix that first.
Detect Silent Sentinel Configuration Drift
//Identify changes to Sentinel configuration that did not trigger alerts but may indicate misconfiguration, unauthorized tuning, or attacker cleanup.
SentinelAuditLogs
| where TimeGenerated > ago(30d)
| where OperationName has_any (
    "AnalyticsRule",
    "AutomationRule",
    "AlertRuleTemplate",
    "WorkspaceSettings"
)
| summarize
    Changes=count(),
    FirstSeen=min(TimeGenerated),
    LastSeen=max(TimeGenerated)
    by OperationName, Actor, ResourceId
| order by LastSeen desc
This query helps identify the following:
- Attackers and over-privileged admins change SIEM settings quietly
- This query establishes platform integrity visibility
- Ideal for monthly Sentinel health reviews
Part 1 Takeaway
You now have:
- A secure workspace
- Predictable cost controls
- Proper access boundaries
No alerts yet. That’s a feature.