KQL from Raw Logs to Useful Security Detections
Kusto Query Language—better known as KQL—is one of the most useful skills available to Azure administrators, security engineers, and SOC analysts.
KQL allows us to explore large volumes of telemetry, isolate important events, identify patterns, summarize activity, build visualizations, and turn successful hunting queries into operational detections.
It is used throughout Azure Monitor, Log Analytics, Microsoft Sentinel, Microsoft Defender XDR, Azure Data Explorer, and several other Microsoft services.
The difficult part is rarely understanding what KQL can do. The challenge is knowing where to begin when you are staring at an unfamiliar table containing thousands—or millions—of records.
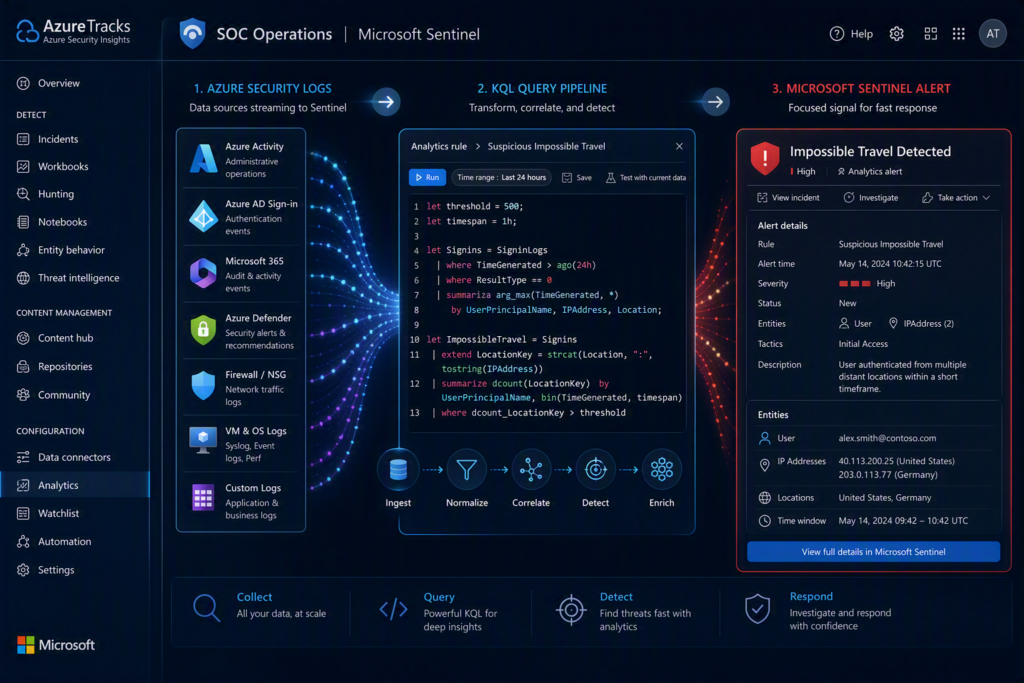
In this Saturday bonus article, we will build several practical security queries progressively. We will begin by reviewing raw Microsoft Entra sign-in data, add filters, summarize the results, extract values from dynamic fields, visualize activity, establish a simple behavioral baseline, correlate failures with successful sign-ins, and finish by turning a validated query into a Microsoft Sentinel analytics rule.
You do not need to memorize every KQL operator.
The most important skill is learning how to build, inspect, and validate a query one step at a time.
Let’s dive right in together!
Goal: Use KQL to move from raw Microsoft Entra sign-in logs to useful investigation results and a practical Microsoft Sentinel detection.
What are we solving?
Security platforms collect a tremendous amount of information, but collected information does not automatically become useful information.
A Log Analytics workspace may contain:
- Microsoft Entra sign-ins
- Azure Activity logs
- Endpoint process events
- Firewall and network events
- Microsoft Defender alerts
- Identity telemetry
- Application logs
- Cloud workload events
- Threat intelligence
- Microsoft Sentinel incidents
Without useful queries, high-value security signals can remain buried inside routine activity.
KQL gives us a repeatable way to answer operational questions such as:
- Which users are generating repeated sign-in failures?
- Which IP addresses are associated with those failures?
- Did a successful sign-in occur after several failures?
- Are successful sign-ins appearing from countries that are new for a user?
- Which Azure resources were deleted during the last 24 hours?
- Which devices executed suspicious PowerShell command lines?
- Is an event reliable enough to become a Microsoft Sentinel detection?
KQL queries follow a pipeline structure. A query normally begins with a table and passes the records through filtering, parsing, summarization, sorting, and output stages. Microsoft recommends filtering data early so later operations process only the records relevant to the investigation.
The safest approach is to start with a broad but controlled view, inspect the available data, and progressively narrow the results.
Security outcome
- Analysts can locate useful security telemetry without exporting it to another platform.
- Repeated sign-in failures can be grouped into investigation-ready results.
- Dynamic fields such as sign-in location can be converted into searchable columns.
- Query results can be visualized to identify trends and spikes.
- Current behavior can be compared against a historical baseline.
- Failed and successful sign-ins can be correlated to identify higher-risk sequences.
- Validated hunting queries can be converted into Microsoft Sentinel analytics rules.
- Query performance is improved by filtering time and unnecessary data early.
- Detection logic can be documented, tuned, versioned, and handed over to normal SOC operations.
What you will Deploy & Configure
- A repeatable process for examining unfamiliar Log Analytics tables.
- A progressive KQL query using the
SigninLogstable. - Filtering and column-selection logic using
whereandproject. - Aggregation using
summarize,count,min,max, andmake_set. - Time-based grouping using
bin. - Dynamic-value extraction using
extendandtostring. - A timechart showing failed sign-in activity.
- A behavioral query identifying successful sign-ins from new countries.
- A correlation query identifying success after repeated failures.
- A scheduled Microsoft Sentinel analytics rule.
- Entity mapping for the affected account and source IP address.
- A validation, troubleshooting, tuning, and rollback process.
Microsoft baseline: Build and test the KQL query in the Logs experience before creating an analytics rule. The final analytics query should return only the records that require investigation and must preserve the TimeGenerated column for scheduled-rule processing.
Special Highlight: A query returning results is not automatically a good detection. A useful detection must be understandable, repeatable, sufficiently uncommon, operationally owned, and mapped to a response process.
Prerequisites
- A Log Analytics workspace containing relevant security telemetry.
- Microsoft Entra sign-in logs being sent to the workspace.
- Microsoft Sentinel connected to the workspace if you plan to create an analytics rule.
- Recent sign-in activity in the tenant.
- Log Analytics Reader, Microsoft Sentinel Reader, or equivalent permissions for query testing.
- Microsoft Sentinel Contributor or equivalent write permissions to create an analytics rule.
- A test user, pilot group, or documented event that can be used during validation.
- An identified SOC or platform owner for any resulting alert.
- A defined review period before the rule is promoted into wider production use.
The SigninLogs table includes fields such as TimeGenerated, UserPrincipalName, IPAddress, AppDisplayName, ResultType, ConditionalAccessStatus, and dynamic sign-in details. Available fields and data can vary according to the sign-in type, tenant configuration, licensing, and diagnostic settings.
A query cannot return data from a table that is not being populated, regardless of how accurate the KQL syntax may be.
Before-state checklist
Capture the before state first. This creates documentation that administrators can use to understand what changed and provides evidence for a change request or Change Approval Board review.
- Confirm the target Log Analytics workspace.
- Record the Microsoft Sentinel workspace and subscription.
- Confirm which Microsoft Entra diagnostic settings are enabled.
- Verify that
SigninLogscontains recent records. - Record the most recent
TimeGeneratedvalue. - Capture the current number of active analytics rules.
- Review existing rules for similar sign-in failure detections.
- Identify trusted VPN, proxy, security-service, and corporate egress IP addresses.
- Identify expected service accounts and emergency-access accounts.
- Record the initial detection threshold.
- Define who will review resulting alerts.
- Record the intended query frequency and lookback period.
- Define the expected pilot duration.
- Document how the rule will be disabled if it generates excessive noise.
A useful initial validation query is:
SigninLogs
| summarize
    RecordCount = count(),
    OldestRecord = min(TimeGenerated),
    NewestRecord = max(TimeGenerated)
The expected result is a record count greater than zero and a recent value in NewestRecord.
Lab build
Use a test workspace or a controlled production pilot first.
The following walkthrough uses the SigninLogs table, but the same progressive method can be used with other Microsoft Sentinel and Azure Monitor tables.
Open the Microsoft Defender portal and navigate to:
Microsoft Sentinel → Investigation & response → Hunting → Advanced hunting
Depending on the workspace experience, you may also use:
Microsoft Sentinel → General → Logs
or:
Azure portal → Log Analytics workspaces → Your workspace → Logs
Microsoft Sentinel is moving toward the Microsoft Defender portal as its primary operational experience. Microsoft currently documents that Azure portal support for Microsoft Sentinel will end after March 31, 2027, so new operational procedures should increasingly account for the Defender portal experience.
Step 1 – Confirm that the table contains data
Begin with the smallest useful query:
SigninLogs
| take 10
This returns up to ten records from SigninLogs.
The query is not yet useful as a detection, but it answers the first important question:
Does the table contain data that we can query?
Expand several records and review the available fields.
Useful columns may include:
TimeGeneratedUserPrincipalNameIPAddressAppDisplayNameResourceDisplayNameResultTypeResultDescriptionConditionalAccessStatusAuthenticationRequirementLocationDetailsDeviceDetailRiskLevelDuringSignInRiskState
When learning a new table, the available values are often more important than the column names alone.
A field named ResultType, for example, tells us little until we inspect the values it contains.
Step 2 – Add a time filter and select useful columns
Security queries should normally restrict the time range as early as possible.
SigninLogs
| where TimeGenerated >= ago(24h)
| project
    TimeGenerated,
    UserPrincipalName,
    IPAddress,
    AppDisplayName,
    ResourceDisplayName,
    ResultType,
    ResultDescription,
    ConditionalAccessStatus
| order by TimeGenerated desc
| take 50
This query:
- Reads records from
SigninLogs. - Limits the data to the last 24 hours.
- Returns only the columns required for the investigation.
- Places the newest events first.
- Limits the displayed results to 50 rows.
The pipe character passes the output from one operation into the next.
I like to think of each pipe as another refinement stage:
Get data
    |
Filter time
    |
Select fields
    |
Sort results
    |
Return final records
Microsoft’s KQL guidance recommends applying selective filters early because this reduces the amount of data processed by later operations.
Step 3 – Filter for failed sign-ins
Successful Microsoft Entra sign-ins normally have a ResultType value of "0".
We can exclude those records to focus on failures:
SigninLogs
| where TimeGenerated >= ago(24h)
| where ResultType != "0"
| project
    TimeGenerated,
    UserPrincipalName,
    IPAddress,
    AppDisplayName,
    ResourceDisplayName,
    ResultType,
    ResultDescription,
    ConditionalAccessStatus
| order by TimeGenerated desc
This query is already more useful.
Instead of reviewing every sign-in, we are reviewing only unsuccessful activity.
There may still be hundreds of separate failure records, however. We need to group related events into something an analyst can review efficiently.
Step 4 – Summarize repeated failures
The summarize operator aggregates multiple records into a smaller result set.
SigninLogs
| where TimeGenerated >= ago(24h)
| where ResultType != "0"
| summarize
    FailedAttempts = count(),
    FirstSeen = min(TimeGenerated),
    LastSeen = max(TimeGenerated),
    Applications = make_set(AppDisplayName, 10),
    FailureReasons = make_set(ResultDescription, 10)
    by UserPrincipalName, IPAddress
| order by FailedAttempts desc
This groups failed sign-ins by user and source IP address.
Instead of displaying every individual failure, it provides:
- The number of failed attempts
- The first observed failure
- The most recent failure
- The applications involved
- The reported failure reasons
The summarize operator is one of the most important tools in KQL because it converts high-volume event data into aggregated investigation results.
Step 5 – Add a threshold and time buckets
A user mistyping a password once is rarely interesting.
Ten failures during a short period may deserve attention.
let FailureThreshold = 10;
SigninLogs
| where TimeGenerated >= ago(24h)
| where ResultType != "0"
| summarize
    FailedAttempts = count(),
    FirstSeen = min(TimeGenerated),
    LastSeen = max(TimeGenerated),
    Applications = make_set(AppDisplayName, 10),
    FailureReasons = make_set(ResultDescription, 10)
    by
        UserPrincipalName,
        IPAddress,
        WindowStart = bin(TimeGenerated, 15m)
| where FailedAttempts >= FailureThreshold
| order by FailedAttempts desc
There are two important additions.
First, the let statement creates a reusable threshold:
let FailureThreshold = 10;This makes the query easier to read and tune.
Second, the bin function groups events into 15-minute periods:
WindowStart = bin(TimeGenerated, 15m)Without time buckets, ten failures spread throughout an entire day could be grouped together and appear more suspicious than they are.
Thresholds must be tuned against the normal behavior of your environment. Ten failures may be meaningful in one tenant and routine in another.
Step 6 – Extract country and city from a dynamic field
Some KQL columns contain structured information stored as a dynamic object.
LocationDetails is a common example.
We can extract individual properties and convert them into normal columns:
SigninLogs
| where TimeGenerated >= ago(24h)
| extend
    Country = tostring(LocationDetails.countryOrRegion),
    State = tostring(LocationDetails.state),
    City = tostring(LocationDetails.city)
| project
    TimeGenerated,
    UserPrincipalName,
    IPAddress,
    AppDisplayName,
    ResultType,
    Country,
    State,
    City
| order by TimeGenerated desc
The extend operator creates calculated columns while preserving the original record.
The tostring() function converts the selected dynamic value into a searchable string.
We can now summarize successful sign-ins by country:
SigninLogs
| where TimeGenerated >= ago(7d)
| where ResultType == "0"
| extend Country = tostring(LocationDetails.countryOrRegion)
| where isnotempty(Country)
| summarize
    SuccessfulSignins = count(),
    UniqueUsers = dcount(UserPrincipalName)
    by Country
| order by SuccessfulSignins desc
This provides a useful tenant-level view of sign-in geography.
Remember that IP-derived location is contextual information—not definitive proof of a user’s physical location. VPN services, mobile carriers, secure web gateways, cloud proxies, and other network architectures can affect geolocation.
Step 7 – Visualize sign-in failures over time
KQL can render query results directly as a chart.
SigninLogs
| where TimeGenerated >= ago(7d)
| where ResultType != "0"
| summarize
    FailedSignins = count()
    by bin(TimeGenerated, 1h)
| render timechart
This shows hourly failed sign-in volume during the last seven days.
Charts are useful for identifying:
- Sudden authentication spikes
- Repeating activity at specific times
- Changes following a policy deployment
- Differences between weekday and weekend activity
- Thresholds that may create excessive alert volume
The render operator is useful during investigation, hunting, workbooks, and query tuning. Remove it before converting the query into an analytics rule because analytics rules require tabular output rather than a visualization.
Step 8 – Find successful sign-ins from a country that is new for the user
We can compare recent activity against a longer historical period.
The following query establishes a baseline using successful sign-ins from the previous 14 days, excluding the most recent day.
It then identifies successful user-and-country combinations that appear during the last day but did not appear in the baseline.
let BaselinePeriod = 14d;
let RecentPeriod = 1d;
let KnownUserCountries =
    SigninLogs
    | where TimeGenerated between (ago(BaselinePeriod) .. ago(RecentPeriod))
    | where ResultType == "0"
    | extend Country = tostring(LocationDetails.countryOrRegion)
    | where isnotempty(UserPrincipalName)
    | where isnotempty(Country)
    | summarize by UserPrincipalName, Country;
SigninLogs
| where TimeGenerated >= ago(RecentPeriod)
| where ResultType == "0"
| extend
    Country = tostring(LocationDetails.countryOrRegion),
    State = tostring(LocationDetails.state),
    City = tostring(LocationDetails.city)
| where isnotempty(UserPrincipalName)
| where isnotempty(Country)
| join kind=leftanti KnownUserCountries on UserPrincipalName, Country
| project
    TimeGenerated,
    UserPrincipalName,
    IPAddress,
    AppDisplayName,
    ResourceDisplayName,
    Country,
    State,
    City,
    ConditionalAccessStatus,
    RiskLevelDuringSignIn
| order by TimeGenerated desc
The important operation is:
| join kind=leftanti KnownUserCountries on UserPrincipalName, CountryA leftanti join returns records from the recent dataset that do not have a matching user-and-country combination in the historical dataset.
This is a useful hunting lead, but it is not proof of malicious behavior.
Expected reasons for new countries can include:
- User travel
- Corporate VPN changes
- Mobile carrier routing
- Security proxy routing
- New remote-work locations
- Changes to Microsoft or third-party service infrastructure
- Incomplete historical data
This query should initially be used as a hunting query or workbook result. Promote it into an analytics rule only after expected locations and network paths have been reviewed.
Step 9 – Correlate repeated failures with a later successful sign-in
A successful sign-in following repeated failures from the same user and IP address may be more important than failures alone.
The following query correlates the two event types:
let FailureThreshold = 5;
let SearchPeriod = 1h;
let FailedSignins =
    SigninLogs
    | where TimeGenerated >= ago(SearchPeriod)
    | where ResultType != "0"
    | summarize
        FailedAttempts = count(),
        FirstFailure = min(TimeGenerated),
        LastFailure = max(TimeGenerated),
        FailureReasons = make_set(ResultDescription, 10)
        by UserPrincipalName, IPAddress
    | where FailedAttempts >= FailureThreshold;
let SuccessfulSignins =
    SigninLogs
    | where TimeGenerated >= ago(SearchPeriod)
    | where ResultType == "0"
    | summarize
        SuccessTime = max(TimeGenerated),
        Applications = make_set(AppDisplayName, 10),
        Resources = make_set(ResourceDisplayName, 10)
        by UserPrincipalName, IPAddress;
FailedSignins
| join kind=inner SuccessfulSignins on UserPrincipalName, IPAddress
| where SuccessTime between (LastFailure .. LastFailure + 30m)
| project
    TimeGenerated = SuccessTime,
    UserPrincipalName,
    IPAddress,
    FailedAttempts,
    FirstFailure,
    LastFailure,
    SuccessTime,
    Applications,
    Resources,
    FailureReasons
| order by SuccessTime desc
This query:
- Finds users and IP addresses with at least five failures.
- Finds successful sign-ins from the same user and IP address.
- Joins the two result sets.
- Keeps successes occurring within 30 minutes after the final failure.
- Preserves a
TimeGeneratedcolumn for possible analytics-rule use.
This is still not automatic proof of compromise.
A legitimate user may fail authentication several times before successfully entering the correct password. The value comes from combining the query with additional context such as:
- User risk
- Sign-in risk
- New country or network
- Unmanaged device
- Unfamiliar application
- Impossible or abnormal travel
- Conditional Access results
- Privileged account status
- Subsequent mailbox, endpoint, or Azure activity
Step 10 – Prepare the failed-sign-in query for an analytics rule
The following version is designed as a clean starting point for a scheduled Microsoft Sentinel rule:
let FailureThreshold = 10;
SigninLogs
| where TimeGenerated >= ago(30m)
| where ResultType != "0"
| summarize
    FailedAttempts = count(),
    FirstSeen = min(TimeGenerated),
    LastSeen = max(TimeGenerated),
    Applications = make_set(AppDisplayName, 10),
    FailureReasons = make_set(ResultDescription, 10)
    by
        UserPrincipalName,
        IPAddress,
        WindowStart = bin(TimeGenerated, 15m)
| where FailedAttempts >= FailureThreshold
| project
    TimeGenerated = WindowStart,
    UserPrincipalName,
    IPAddress,
    FailedAttempts,
    FirstSeen,
    LastSeen,
    Applications,
    FailureReasons
The final project operation creates the TimeGenerated field required by the scheduled analytics-rule workflow.
Before creating the rule, run the query against several different periods:
- Last 24 hours
- Last 7 days
- Last 14 days
Record:
- Number of results
- Accounts involved
- IP addresses involved
- Failure reasons
- Expected service-account activity
- Trusted corporate or VPN sources
- Whether results are actionable
Step 11 – Create the Microsoft Sentinel scheduled analytics rule
In the Microsoft Defender portal, navigate to:
Microsoft Sentinel → Configuration → Analytics
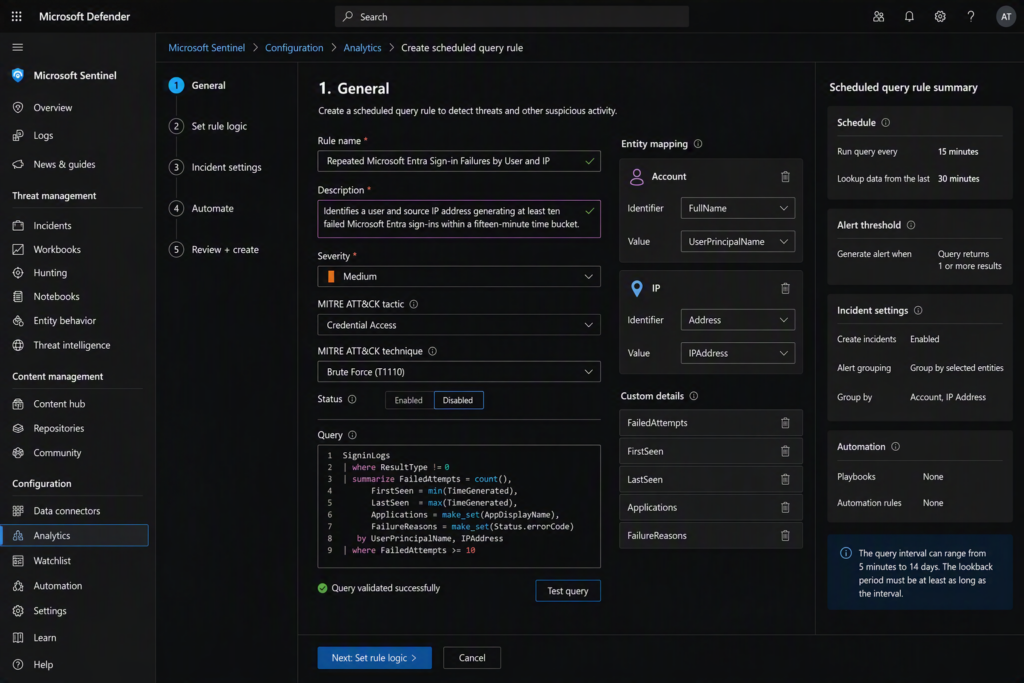
Then:
- Select Create.
- Select Scheduled query rule.
- Enter a descriptive rule name.
Example:
Repeated Microsoft Entra Sign-in Failures by User and IP- Add a clear description.
Example:
Identifies a user and source IP address generating at least ten failed Microsoft Entra sign-ins within a fifteen-minute time bucket.- Set the initial severity to Medium.
- Select the applicable MITRE ATT&CK tactic and technique based on your finalized detection logic.
- Keep the rule disabled during initial configuration if you want to complete validation before execution.
- Paste the tested KQL into the rule query field.
- Confirm that the wizard validates the query.
- Map the account entity:
Entity: Account
Identifier: FullName
Value: UserPrincipalName- Map the IP entity:
Entity: IP
Identifier: Address
Value: IPAddress- Add useful custom details:
FailedAttempts
FirstSeen
LastSeen
Applications
FailureReasons- Configure the initial schedule:
Run query every: 15 minutes
Lookup data from the last: 30 minutes- Configure the alert threshold to generate an alert when the query returns one or more results.
- Configure incident creation.
- Group alerts using the account and IP address where appropriate.
- Avoid attaching automatic containment during the initial pilot.
- Review the configuration.
- Create the rule.
- Enable it only when the pilot owner and SOC reviewer are ready.
Microsoft’s analytics-rule workflow supports entity mapping, custom details, configurable query intervals, lookback periods, incident creation, and alert grouping. The query interval can range from five minutes to 14 days, and the lookback period must be at least as long as the interval.
Bonus KQL examples
The progressive method used above can be applied to many other security scenarios.
Azure resource deletions
This query identifies successful Azure resource deletion operations during the last 24 hours:
AzureActivity
| where TimeGenerated >= ago(24h)
| where ActivityStatusValue == "Success"
| where OperationNameValue endswith "/delete"
| project
    TimeGenerated,
    Caller,
    CallerIpAddress,
    SubscriptionId,
    ResourceGroup,
    ResourceId,
    OperationNameValue,
    CorrelationId
| order by TimeGenerated desc
The AzureActivity table is populated when Azure Activity Log data is sent to the Log Analytics workspace. Activity Log records describe subscription-level and resource-provider control-plane operations.
Conditional Access failures
This query summarizes sign-ins that failed Conditional Access evaluation:
SigninLogs
| where TimeGenerated >= ago(24h)
| where ConditionalAccessStatus =~ "failure"
| summarize
    FailedSignins = count(),
    FirstSeen = min(TimeGenerated),
    LastSeen = max(TimeGenerated),
    SourceIPs = make_set(IPAddress, 20),
    Applications = make_set(AppDisplayName, 20),
    ResultDescriptions = make_set(ResultDescription, 20)
    by UserPrincipalName
| order by FailedSignins desc
This is useful when reviewing:
- Policy rollout effects
- Legacy authentication
- Device-compliance failures
- Location-based access controls
- Authentication-strength requirements
- Unexpected application access
A Conditional Access failure is not necessarily malicious. Review which policy applied and whether the failure represents a working security control or an unexpected access problem.
Suspicious PowerShell command lines
The following query is intended for Microsoft Defender XDR Advanced Hunting or an environment where DeviceProcessEvents is available:
DeviceProcessEvents
| where Timestamp >= ago(24h)
| where FileName in~ ("powershell.exe", "pwsh.exe")
| where ProcessCommandLine has_any (
    "-enc",
    "-encodedcommand",
    "DownloadString",
    "Invoke-Expression",
    "IEX"
)
| project
    Timestamp,
    DeviceName,
    AccountUpn,
    FileName,
    ProcessCommandLine,
    InitiatingProcessFileName,
    InitiatingProcessCommandLine
| order by Timestamp desc
DeviceProcessEvents contains process-creation and related endpoint events when Microsoft Defender for Endpoint telemetry is available.
The strings in this sample can also appear in legitimate administrative scripts. Review the initiating process, signer, user, device role, network activity, and surrounding timeline before escalating.
Daily alert volume by severity
SecurityAlert
| where TimeGenerated >= ago(7d)
| summarize
    AlertCount = count()
    by AlertSeverity, bin(TimeGenerated, 1d)
| order by TimeGenerated asc
| render timechart
This is a simple way to review whether alert volume is increasing and whether severity distribution is useful.
If nearly everything is marked High severity, the severity model may not be helping analysts prioritize work.
Change-window notes
- Build the query before opening the production change.
- Run the query over historical data to estimate alert volume.
- Record the expected number of daily results.
- Identify accounts or IP ranges requiring documented exclusions.
- Keep the first detection pilot intentionally narrow.
- Create the rule disabled when approval requires a separate activation step.
- Schedule activation when an analyst can immediately review results.
- Do not attach automatic containment during the first pilot.
- Preserve screenshots of the query results and final rule settings.
- Record query text, threshold, schedule, lookback, entities, and incident settings in the change ticket.
- Pre-stage the rule-disable procedure as the primary rollback.
- Do not delete the query during rollback; preserve it for analysis and tuning.
A smaller but fully validated detection is more valuable than a large rule deployment with unclear ownership and excessive alerts.
Production hardening
For production, treat KQL detections as managed security content—not as one-time queries stored in an analyst’s browser history.
- Use meaningful names for rules, queries, workbooks, and functions.
- Add comments to explain thresholds and unusual query logic.
- Use
letstatements for thresholds and reusable values. - Apply the time filter near the beginning of the query.
- Select only required columns.
- Avoid expensive joins against unnecessary data.
- Limit dynamic expansion to the properties required.
- Preserve
TimeGeneratedin analytics-rule output. - Map relevant account, host, IP, cloud-resource, URL, and file entities.
- Add useful fields as custom alert details.
- Separate hunting queries from production detections.
- Review false positives before adding exclusions.
- Make exclusions specific rather than global.
- Store rules and queries in source control.
- Record the owner, version, approval, and last-tuned date.
- Review detection performance and query execution regularly.
- Use rule insights and execution-management features when available to identify failures or inefficient rules.
- Export production rules to infrastructure-as-code or another controlled configuration format.
- Test material changes in a sandbox workspace.
- Use automation only after the detection has demonstrated stable results.
- Review Microsoft-authored analytics-rule templates before creating duplicate custom logic.
For high-volume data, consider whether a summary rule, transformation, or more efficient table strategy is appropriate. Microsoft Sentinel summary rules can aggregate verbose data into smaller custom tables for reporting and analysis scenarios.
Operational Handoff
Here is a short list of what is needed to hand the detection over to normal SOC operations:
- Store the final KQL with the Sentinel rule documentation.
- Record the purpose of the detection.
- Document the data-source and connector dependency.
- Record the threshold and why it was chosen.
- Document entity mappings.
- Record expected false-positive scenarios.
- Identify trusted IP ranges and service accounts.
- Document the analyst investigation steps.
- Identify the escalation owner.
- Define the response time.
- Record the rule schedule and lookback period.
- Define the tuning-review cadence.
- Record the rollback method.
- Add the rule to the monthly analytics-rule review.
- Review exclusions quarterly.
- Retire rules that no longer provide useful security value.
- Revalidate the rule whenever its source table, connector, or schema changes.
A simple analyst runbook for the repeated-failure rule could be:
- Confirm the affected user and source IP.
- Review the complete sign-in timeline.
- Check whether a successful sign-in followed the failures.
- Review country, city, application, device, and Conditional Access results.
- Check user and sign-in risk.
- Confirm whether the user was active at the time.
- Review whether the IP belongs to a trusted VPN or proxy.
- Review endpoint and cloud activity following the sign-in.
- Reset credentials or revoke sessions only when the investigation supports containment.
- Document the reason for closure or escalation.
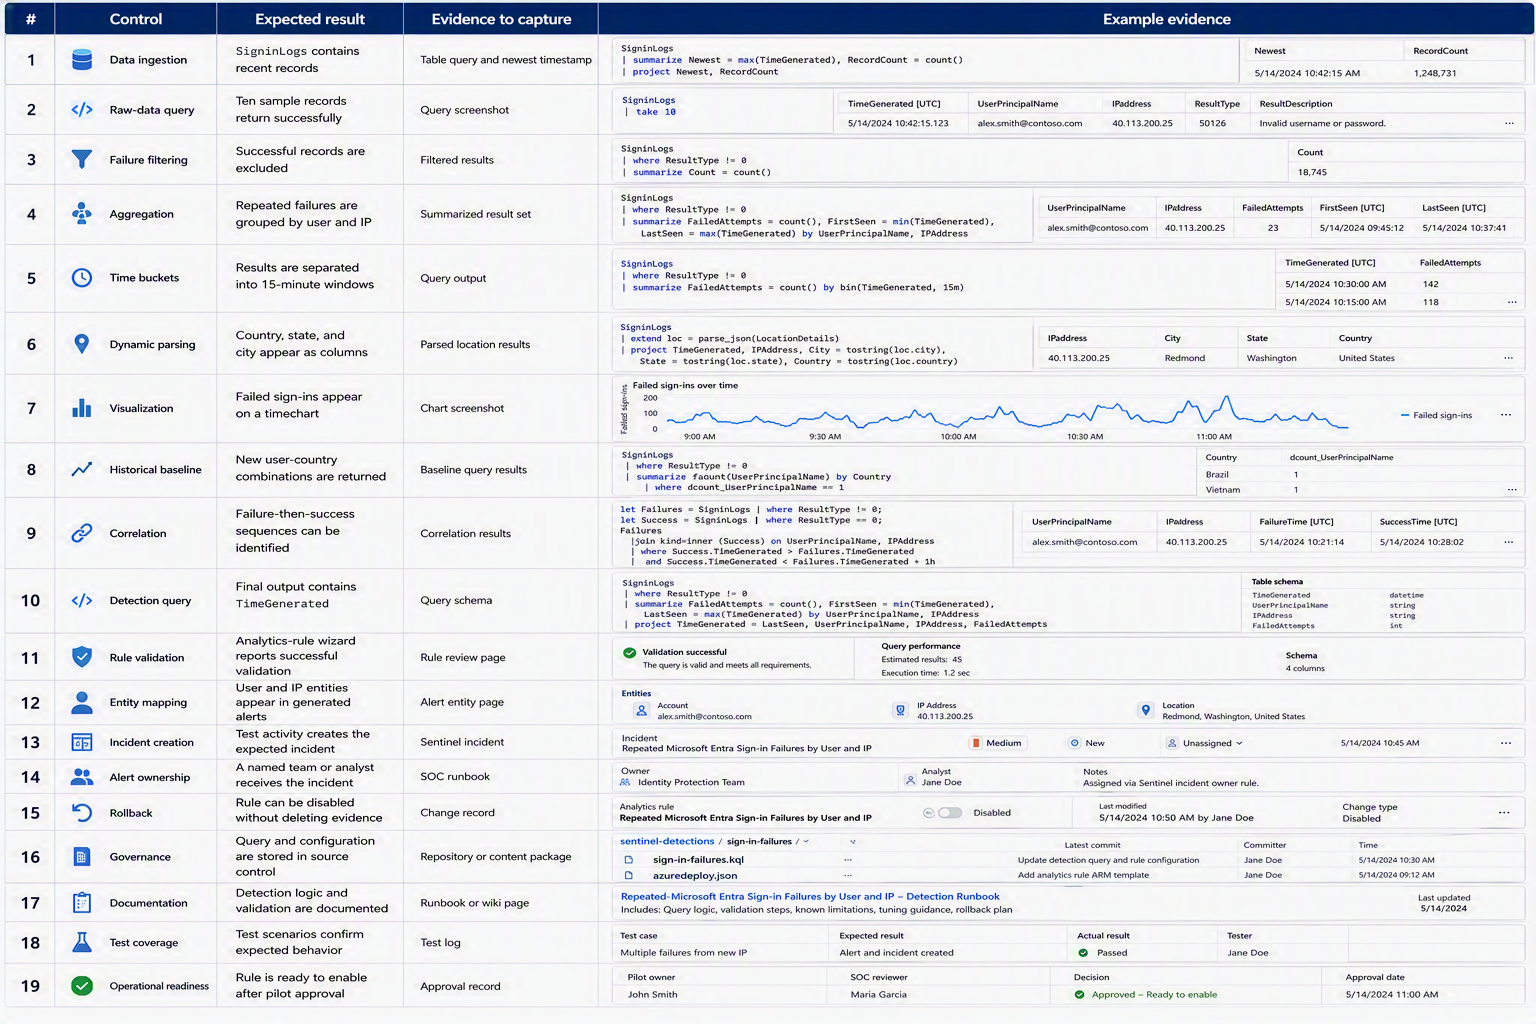
Finished-state Validation
| Control | Expected result | Evidence to capture |
|---|---|---|
| Data ingestion | SigninLogs contains recent records | Table query and newest timestamp |
| Raw-data query | Ten sample records return successfully | Query screenshot |
| Failure filtering | Successful records are excluded | Filtered results |
| Aggregation | Repeated failures are grouped by user and IP | Summarized result set |
| Time buckets | Results are separated into 15-minute windows | Query output |
| Dynamic parsing | Country, state, and city appear as columns | Parsed location results |
| Visualization | Failed sign-ins appear on a timechart | Chart screenshot |
| Historical baseline | New user-country combinations are returned | Baseline query results |
| Correlation | Failure-then-success sequences can be identified | Correlation results |
| Detection query | Final output contains TimeGenerated | Query schema |
| Rule validation | Analytics-rule wizard reports successful validation | Rule review page |
| Entity mapping | User and IP entities appear in generated alerts | Alert entity page |
| Incident creation | Test activity creates the expected incident | Sentinel incident |
| Alert ownership | A named team or analyst receives the incident | SOC runbook |
| Rollback | Rule can be disabled without deleting evidence | Change record |
| Governance | Query and configuration are stored in source control | Repository or content package |
Cost and Licensing Notes
Running KQL queries does not normally create a separate per-query charge in the same way that deploying a new Azure workload would.
The major cost drivers are generally associated with:
- Log ingestion
- Data retention
- Archive or restoration
- Search jobs
- Auxiliary or Basic log plans
- Microsoft Sentinel enablement
- Microsoft Defender licensing
- Data duplication across workspaces
- High-volume connectors
- Workbook and rule designs that repeatedly scan unnecessary data
An inefficient query is primarily an operational and performance problem, but high-volume data collection and retention can create material cost.
Before onboarding an additional log source, confirm:
- Expected daily ingestion volume
- Table plan
- Retention requirement
- Detection value
- Compliance requirement
- Whether duplicate telemetry is already available
- Whether all event categories are required
- Whether ingestion-time transformation is appropriate
Azure Monitor supports different table types, plans, retention configurations, and transformation options. Query design should account for the table plan and the available query capabilities.
Known Limitations and Edge Cases
- A query cannot compensate for missing telemetry.
SigninLogsdoes not include every identity event type.- Non-interactive, service-principal, and managed-identity sign-ins can appear in separate tables.
- Field availability can vary by sign-in type.
- IP geolocation is not definitive.
- VPNs and security proxies can make a country appear new.
- Baseline queries require enough historical data to be meaningful.
- New users may naturally trigger first-seen detections.
- A successful sign-in after failures can be legitimate.
- Service accounts may generate repetitive patterns.
- Dynamic fields can be empty or change structure.
- Advanced Hunting and Log Analytics schemas are not identical.
- Some Defender XDR tables use
Timestamprather thanTimeGenerated. - A hunting query may require modification before becoming a Sentinel rule.
- Query results can overlap when the lookback period is longer than the execution interval.
- Alert grouping may be required to prevent duplicate incidents.
- Suppression can hide legitimate repeated activity if configured too broadly.
- Large joins and dynamic-field expansion can affect query performance.
- Analytics rules require ongoing tuning as user behavior and infrastructure change.
Microsoft Entra also has separate tables for non-interactive users, service principals, and managed identities. Select the table that matches the identity activity being investigated rather than assuming that all authentication events are in SigninLogs.
Pro Tip: If you are running into either polar opposite here, too much / not enough data; go ahead and check your Microsoft Entra ID data connector and validate which tables are feeding your log analytics workspace. You will need elevated permissions such as Global Admin to make changes to this connector, and you should follow any required change processes you have in place > Especially if you are a doing a limited production PoC.
Troubleshooting
The table does not exist
Confirm that the correct data connector or diagnostic setting is enabled.
Also confirm that you are running the query in the correct workspace.
Check spelling and capitalization. KQL table names are case-sensitive.
The table exists but returns no records
Increase the selected time range and run:
SigninLogs
| summarize
    RecordCount = count(),
    NewestRecord = max(TimeGenerated)
If the count is zero, review the Microsoft Entra diagnostic setting and destination workspace.
The query reports an unknown column
Run:
SigninLogs
| take 1
Inspect the schema and confirm that the field exists in your environment.
Do not assume that every table or connector exposes identical fields.
A dynamic-field expression returns blank values
Inspect the original field:
SigninLogs
| where TimeGenerated >= ago(1h)
| project LocationDetails
| take 20
Confirm the property name and capitalization before extracting it.
The query is slow
- Reduce the time range.
- Place selective
wherefilters earlier. - Remove unused columns.
- Avoid expanding entire dynamic objects.
- Reduce the size of joined datasets.
- Summarize before joining when appropriate.
- Test each query section separately.
- Remove unnecessary sorting.
- Avoid broad wildcard searches when a specific field is available.
The analytics rule rejects the query
Confirm that:
- The query returns tabular results.
- The query contains
TimeGenerated. - There is no
renderstatement. - All tables and columns exist in the rule’s workspace.
- The query does not depend on an unsupported cross-workspace function.
- Each
letstatement ends with a semicolon. - Entity-mapped fields exist in the final output.
The rule creates duplicate alerts
Review:
- Query interval
- Lookback period
- Time buckets
- Incident grouping
- Alert grouping
- Suppression settings
A 15-minute query interval with a 30-minute lookback intentionally overlaps data. This can accommodate ingestion delay, but the rule must be grouped or tuned to avoid unnecessary duplicate incidents.
The rule creates too many alerts
Do not immediately suppress the rule globally.
First:
- Review the most common users.
- Review the most common IP addresses.
- Review failure descriptions.
- Identify trusted network paths.
- Separate user and service-account behavior.
- Increase the threshold carefully.
- Narrow the targeted account or application scope.
- Add specific, documented exclusions.
- Rerun the historical query.
- Record the reason for every tuning change.
The rule creates no alerts
Confirm that:
- The rule is enabled.
- The query returns results during the same lookback period.
- The alert threshold is correct.
- The rule is using the expected workspace.
- The source data is current.
- The query frequency is correct.
- There are no rule-execution errors.
- The rule output contains
TimeGenerated.
Rollback or cleanup
For a lab or test rule:
- Disable the analytics rule.
- Preserve the query text.
- Export or capture the rule configuration.
- Remove test incidents if permitted by the operating procedure.
- Remove temporary watchlists or test exclusions.
- Retain screenshots and validation evidence.
- Document why the test was concluded.
For a production rule:
- Disable the rule as the first rollback action.
- Do not delete it during the initial rollback.
- Preserve incidents and alerts already generated.
- Record the rollback time and approver.
- Restore the previous known-good query or threshold if appropriate.
- Remove automation bindings if they contributed to the issue.
- Confirm that no containment playbook remains active.
- Review the before-state evidence.
- Tune the rule in the test workspace.
- Re-enable it only after validation and approval.
Queries themselves are normally non-disruptive.
The greater operational risk comes from:
- Excessive alert volume
- Incorrect incident creation
- Broad suppression
- Misleading entity mapping
- Automatic containment
- Undocumented exclusions
- Poorly understood detection logic
Think of the query as the beginning of the control—not the end.
Final takeaways
- KQL becomes easier when we stop trying to write the finished detection in a single attempt.
- Start with the table.
- Inspect a few records.
- Add a time filter.
- Select the fields that matter.
- As recent attacks have taught us, do not exclude larger files
- Filter the activity.
- Summarize related events.
- Add time buckets.
- Extract useful context.
- Compare current activity with historical behavior.
- Correlate related event types.
- Only then should the query become an alert.
- A good KQL query does more than return interesting data.
- A good production detection produces a small number of understandable, actionable results that an analyst knows how to investigate.
That is the real path from raw logs to security operations.
About AzureTracks
AzureTracks publishes practical Azure and Microsoft 365 security guidance with deployment, validation, operational, and rollback considerations.
This walkthrough is designed for cloud engineers, security administrators, and SOC teams who want to move beyond copying sample queries and begin building KQL detections that are understandable, testable, and ready for operational use.