Microsoft Sentinel Baseline Deployment
A Practical, Microsoft-Aligned Walkthrough Series
Part 3 – Operational Baseline: Analytics, Automation, and Governance
Miss Part 1? Check it out here.
Miss Part 2? Check it out here.
Sentinel does not fail because it lacks detections.
It fails because alerts overwhelm analysts, automation hides context, and governance is treated as an afterthought.
In this final mini-series post, we establish a production operational baseline: analytics rules, incident handling, automation boundaries, and long-term governance. This is where Sentinel becomes usable—not just enabled.
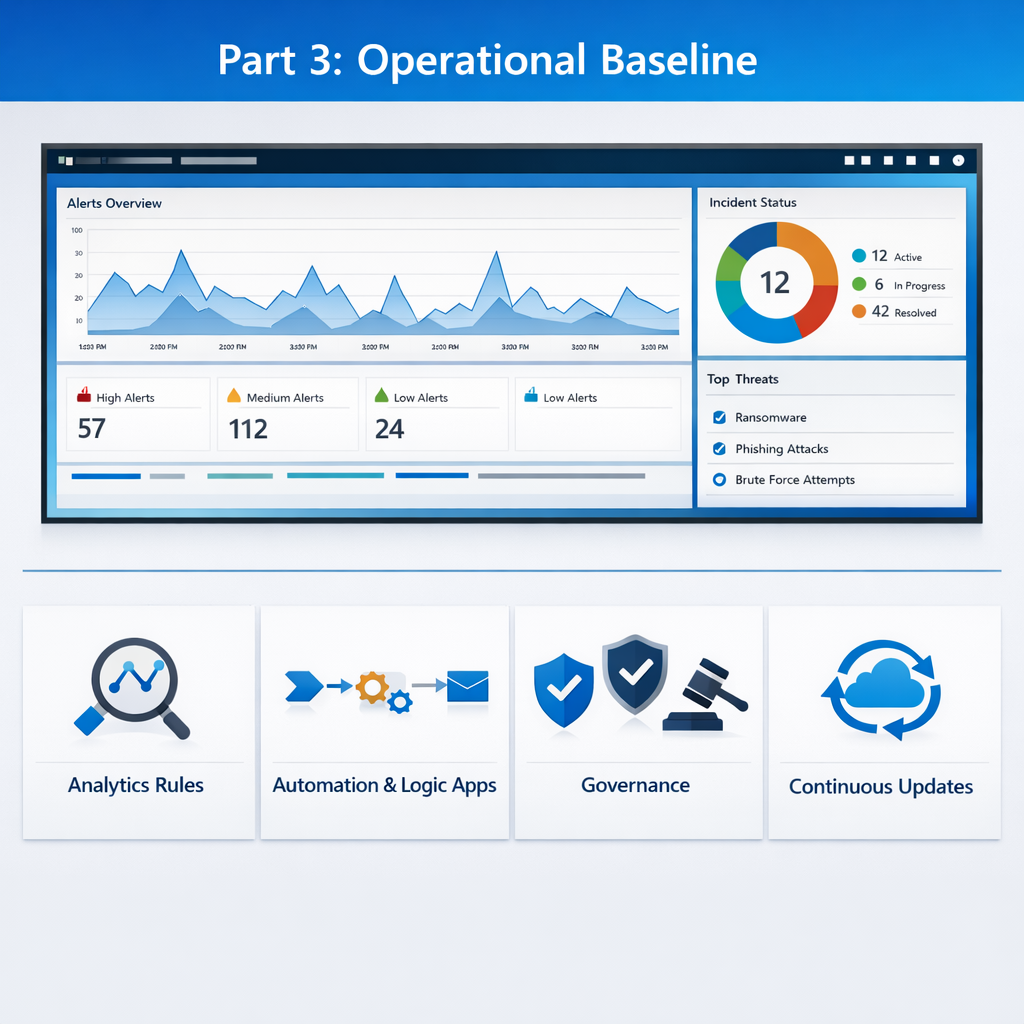
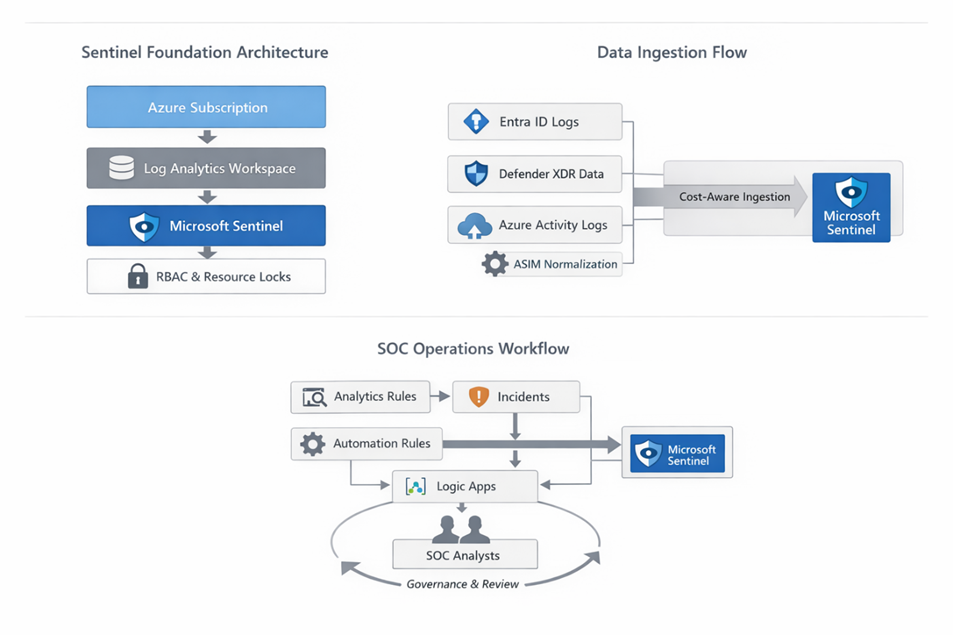
In this third of 3 posts for Sentinel baseline, we bring SOC Operations Workflow into the mix and tie together meaningful data detections, foundational data sources, and start thinking more about automations, incident management, and what to do next!
Does this sound familiar? Deploy into a test environment first. Before enabling analytics rules, Automation Rules, or Logic Apps in production, always deploy them to a sandbox or test workspace. This allows your SOC team to validate alert generation, automation behavior, and incident workflows without risking production systems. Testing first prevents accidental remediation, alert storms, or misconfigurations from impacting real users and resources. Stay tuned until the end of this post to see how this aligns with best practices and you can even copy/paste to help justify creating your own testing Sentinel environment!
Step 1 – Analytics Rules (Less Is More)
Microsoft-Recommended Approach
- Start with Microsoft-authored rules
- Enable in phases
- Monitor alert volume before automation
Example validation:
SecurityAlert
| summarize Alerts = count() by AlertSeverity
If everything is “High,” nothing is.
Step 2 – Incident Grouping and Severity Mapping
Configure:
- Incident grouping by entity
- Time-based aggregation
- Consistent severity mapping
This prevents:
- Alert storms
- Duplicate incidents
- Analyst burnout
Step 3 – Automation Rules First, Logic Apps Second
Baseline Automation Rules
Use Automation Rules for:
- Auto-closing known benign alerts
- Tagging incidents
- Setting severity
Example Logic App use:
- Enrichment
- Ticket creation
- Containment actions
Never store credentials. Always use Managed Identity.
Step 4 – Governance and Change Control
Baseline practices:
- Store analytics rules in source control
- Review detections monthly
- Track ingestion trends
Example audit query:
SentinelAuditLogs
| where OperationName has “Analytics”
| order by TimeGenerated desc
Step 5 – Measure What Matters
Track:
- Mean Time to Acknowledge (MTTA)
- Incidents per analyst
- Cost per GB vs detections generated
If cost increases but detection quality doesn’t, stop and reassess.
Step 6 – Enable Continuous Analytics Content Updates
Why it Matters
- Keeps Microsoft-authored rules current with the latest threat landscape
- Automatically updates rule logic, severity, and thresholds
- Reduces time your SOC spends on manual updates
Walkthrough
- Azure Portal → Microsoft Sentinel → Analytics
- Click Settings → Content updates
- Toggle Enable Microsoft content updates
- Optionally, configure update notifications for your SOC team
Validation Query
SecurityAlert
| summarize AlertsByRule=count() by ProviderName, bin(TimeGenerated, 1d)
| order by AlertsByRule desc
- Ensures your updated rules are generating alerts as expected
Step 7 – Implement Periodic Rule Tuning and Suppression
Why it Matters
- Prevents alert fatigue
- Ensures high-signal alerts remain actionable
Walkthrough
- Review enabled rules monthly
- Identify high-false-positive rules
- Adjust thresholds or disable temporarily
- Document changes for governance
Step 8 – Test Automation in a Sandbox Environment
This step does add cost, and some organizations opt to skip this step and deploy automations and changes directly into Sentinel Production. Remember that the cost of automation mistakes does have an offset, and you don’t have to live in a world of fire-fighting your prod deployments. There is a better way.
Deploy to a test environment first. Before enabling analytics rules, Automation Rules, or Logic Apps in production, validate them in a sandbox workspace. This ensures alerts trigger correctly, automated responses behave as expected, and changes are auditable—all without impacting real users or systems. Testing first reduces risk, prevents alert fatigue, and aligns with Microsoft Sentinel best practices.
Why it Matters
- Prevents accidental auto-remediation on production workloads
- Ensures Logic Apps and Automation Rules execute as expected
Walkthrough
- Clone Automation Rules to a dedicated test workspace
- Configure test Logic Apps with sample alerts
- Validate runbooks complete without impacting production resources
- Only promote tested rules to production
Top 5 Reasons to Deploy Sentinel Changes in a Test Environment First
- Reduce Risk of Production Impact – Prevent misconfigured rules or automation from affecting live systems.
- Validate Alerts and Automation – Ensure analytics rules and Logic Apps trigger correctly and as intended.
- Prevent Alert Fatigue – Test thresholds and suppression to avoid generating meaningless or excessive alerts.
- Support Governance and Compliance – Track changes safely and maintain auditable workflows.
- Enable Repeatable SOC Processes – Establish a controlled deployment process for future rules, connectors, and automation.
Bonus – Advanced Additions
- Monitor Analyst Activity – Use SentinelAuditLogs to track who modifies rules or closes incidents. This is also used in generating Analyst efficiency and identifying types of incidents that should get some automation attention in future reviews.
- Integrate Threat Intelligence Feeds – Baseline TI integration ensures alerts are enriched with external context. TI should ideally be included in a baseline. TI can be from multiple free or paid sources and integrated fully with automations to update incidents before Analysts open an incident….and to build automations that can confirm if activity is potentially malicious so that action can be taken.
- Dashboard Health Monitoring – Add a SOC dashboard for ingestion volume, alert trends, and automation health. A great management and oversight tool; Health monitoring in general falls to our 2 tables SentinelAuditLogs and SentinelHealth, but you should monitor all assets for health status such as connectors, playbooks, and virtual machines.
Privilege Escalation via Role Chaining
// Identify users who receive multiple Azure roles in short succession, often used to assemble effective admin access without obvious “Global Admin” assignment
AzureActivity
| where OperationNameValue contains “roleAssignments/write”
| where ActivityStatusValue == “Success”
| summarize
RolesAssigned=count(),
Roles=make_set(RoleDefinitionName)
by Caller, bin(TimeGenerated, 1h)
| where RolesAssigned >= 2
| order by RolesAssigned desc
This query helps identify the following:
- Attackers avoid obvious high-privilege roles
- Role chaining is stealthy and fast
- This query catches escalation patterns, not single events
Final Series Takeaway
Microsoft Sentinel rewards discipline.
If you:
- Design the workspace intentionally
- Ingest only valuable data
- Treat automation as a scalpel, not a hammer
You get a SIEM that scales calmly—even under pressure.
If you don’t, Sentinel will faithfully amplify every mistake.